Study: Time Spent Streaming VOD, Linear TV Declined in North America This Year
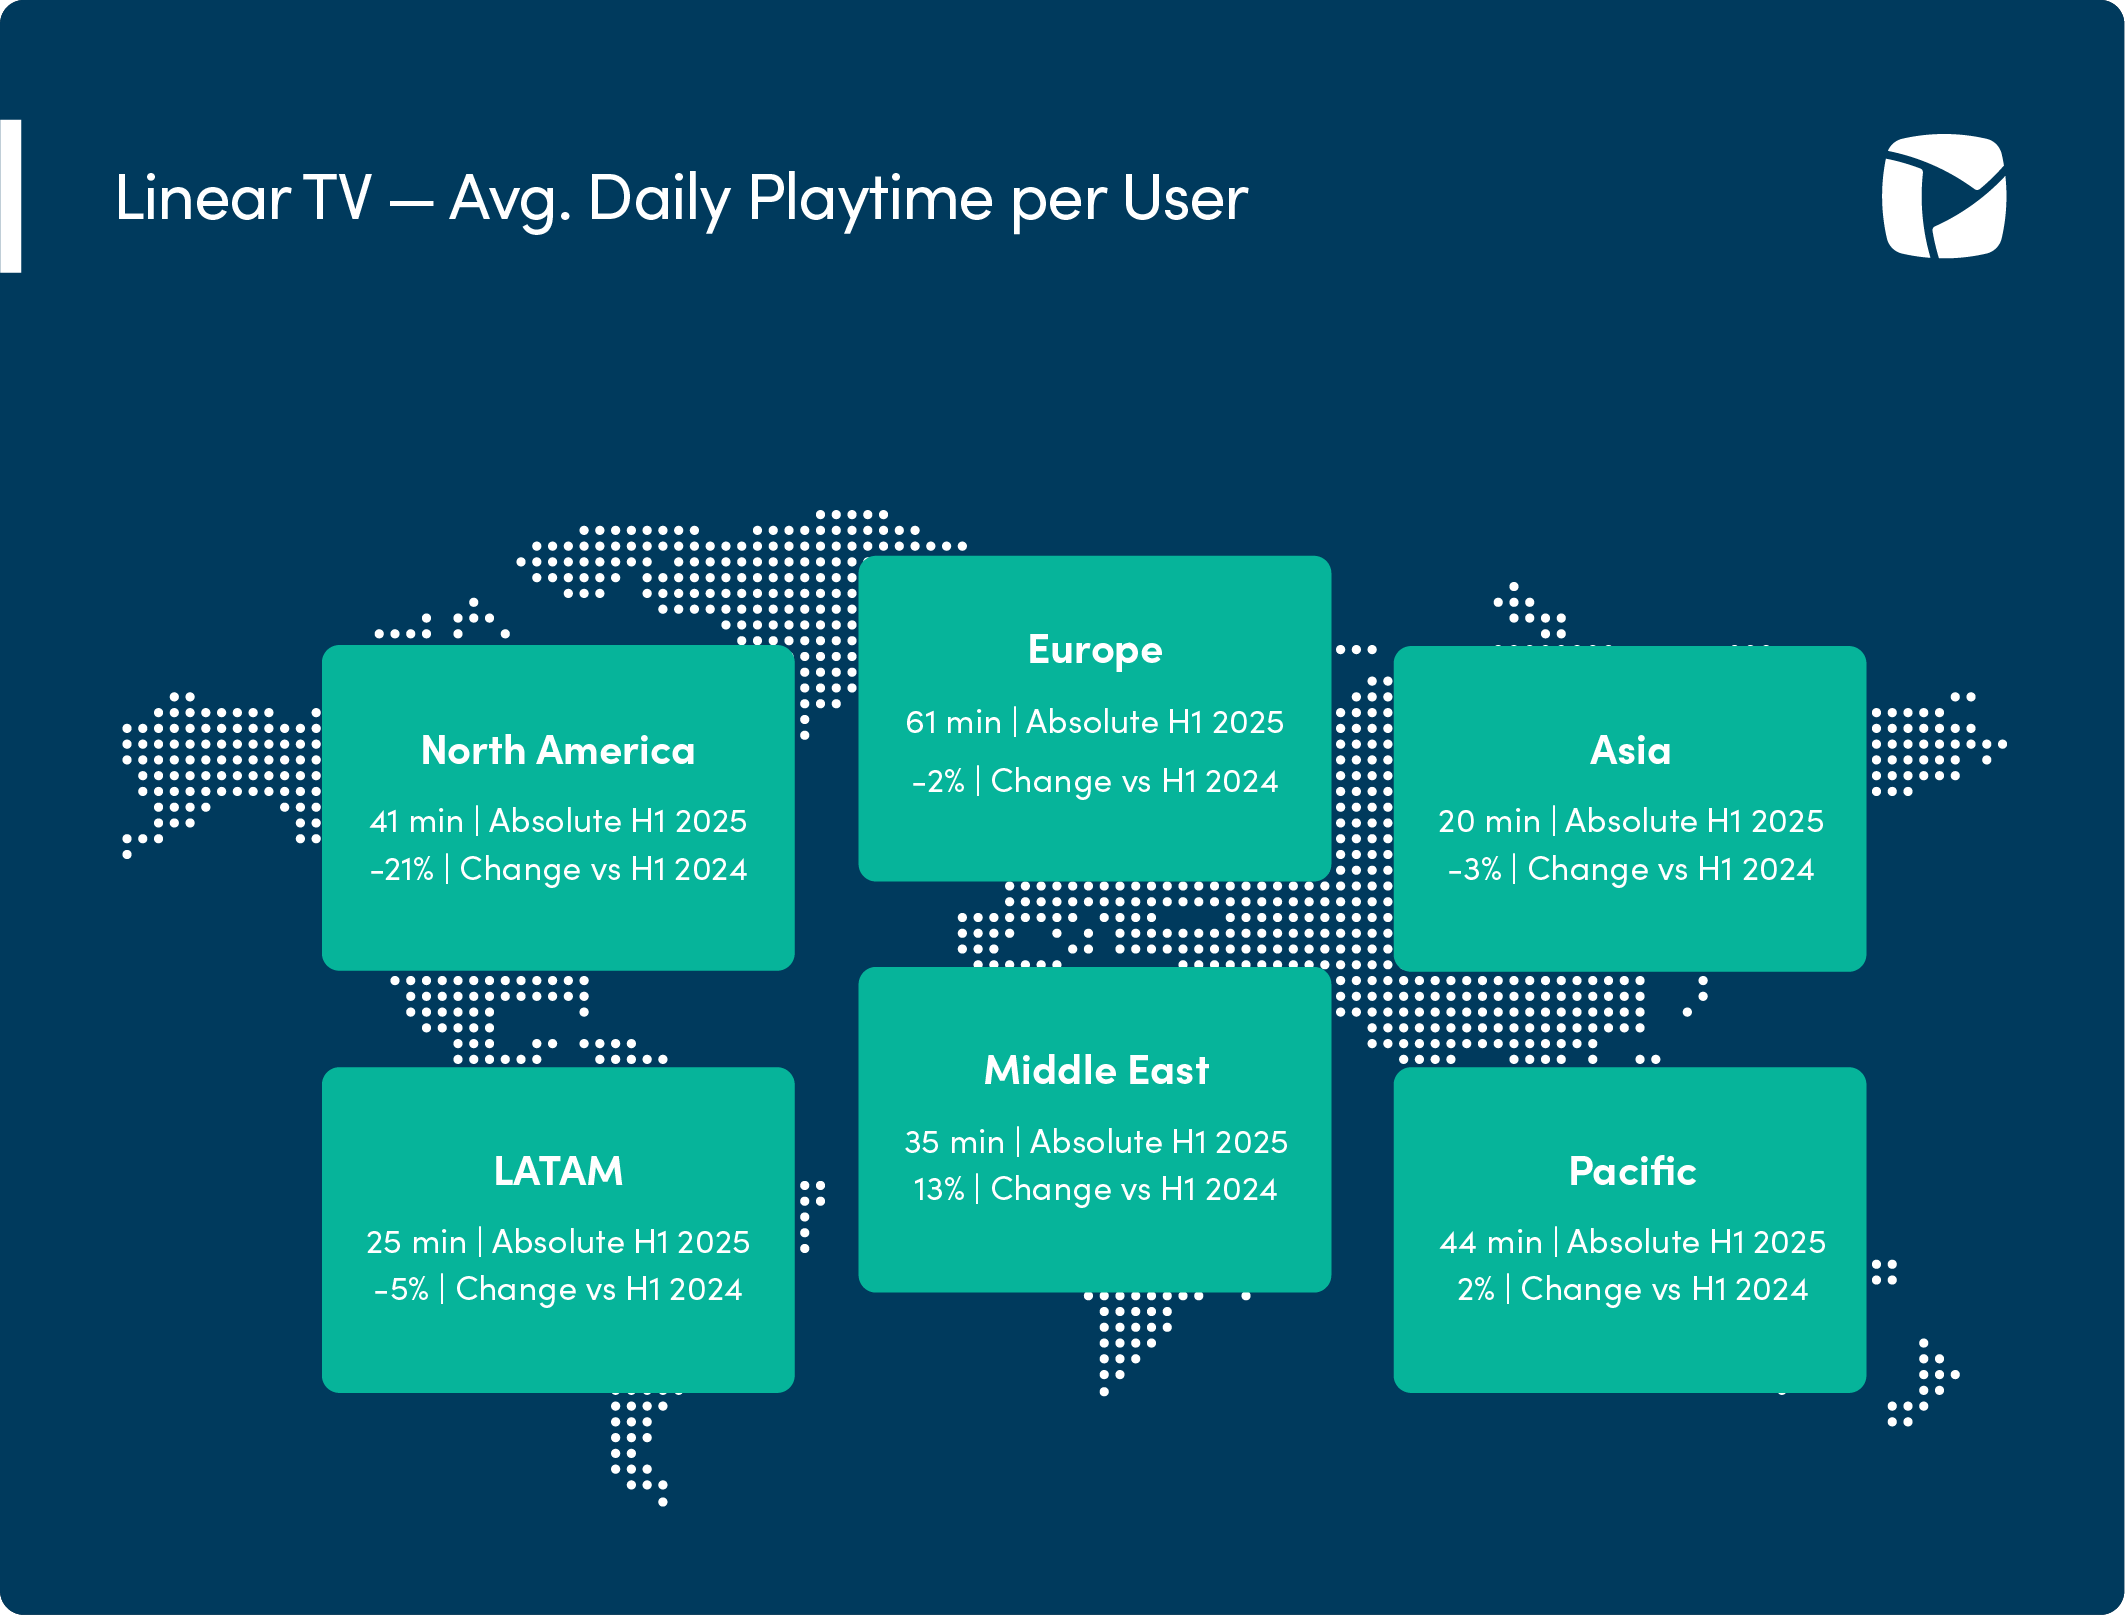
In the first half, average linear TV playtime in North America was 41 minutes a day, down 21% from a year earlier, according to a new NPAW report on streaming

The professional video industry's #1 source for news, trends and product and tech information. Sign up below.
You are now subscribed
Your newsletter sign-up was successful
Global streaming intelligence provider NPAW has released its 1H 2025 report on the state of the streaming video industry with new data showing the average time spent streaming both linear and on demand content fell off in North America during the first half of the year.
North American video-on-demand engagement in the first half of 2025 was 69 minutes per day, down 18% from a year ago, while linear TV fell 21% to 41 minutes over that span.
The report did find some notable improvements in quality KPIs (key performance indicators), average bit rates and average buffer ratio quality. It also highlighted the importance of TV viewing, with TVs continuing to hold by far the highest share of viewing among devices.
"The first half of 2025 displayed some remarkable improvements in quality KPIs across the globe,” explained Ferran G. Vilaro, CEO and co-founder of NPAW. “With LATAM, the Middle East and North America showing the greatest gains, most regions have seen an upward shift in Buffer Ratio quality, Avg. Bitrate and Join Times. These are clear indicators of ongoing investment in infrastructure by OTTs, telco providers and broadcasters alike."
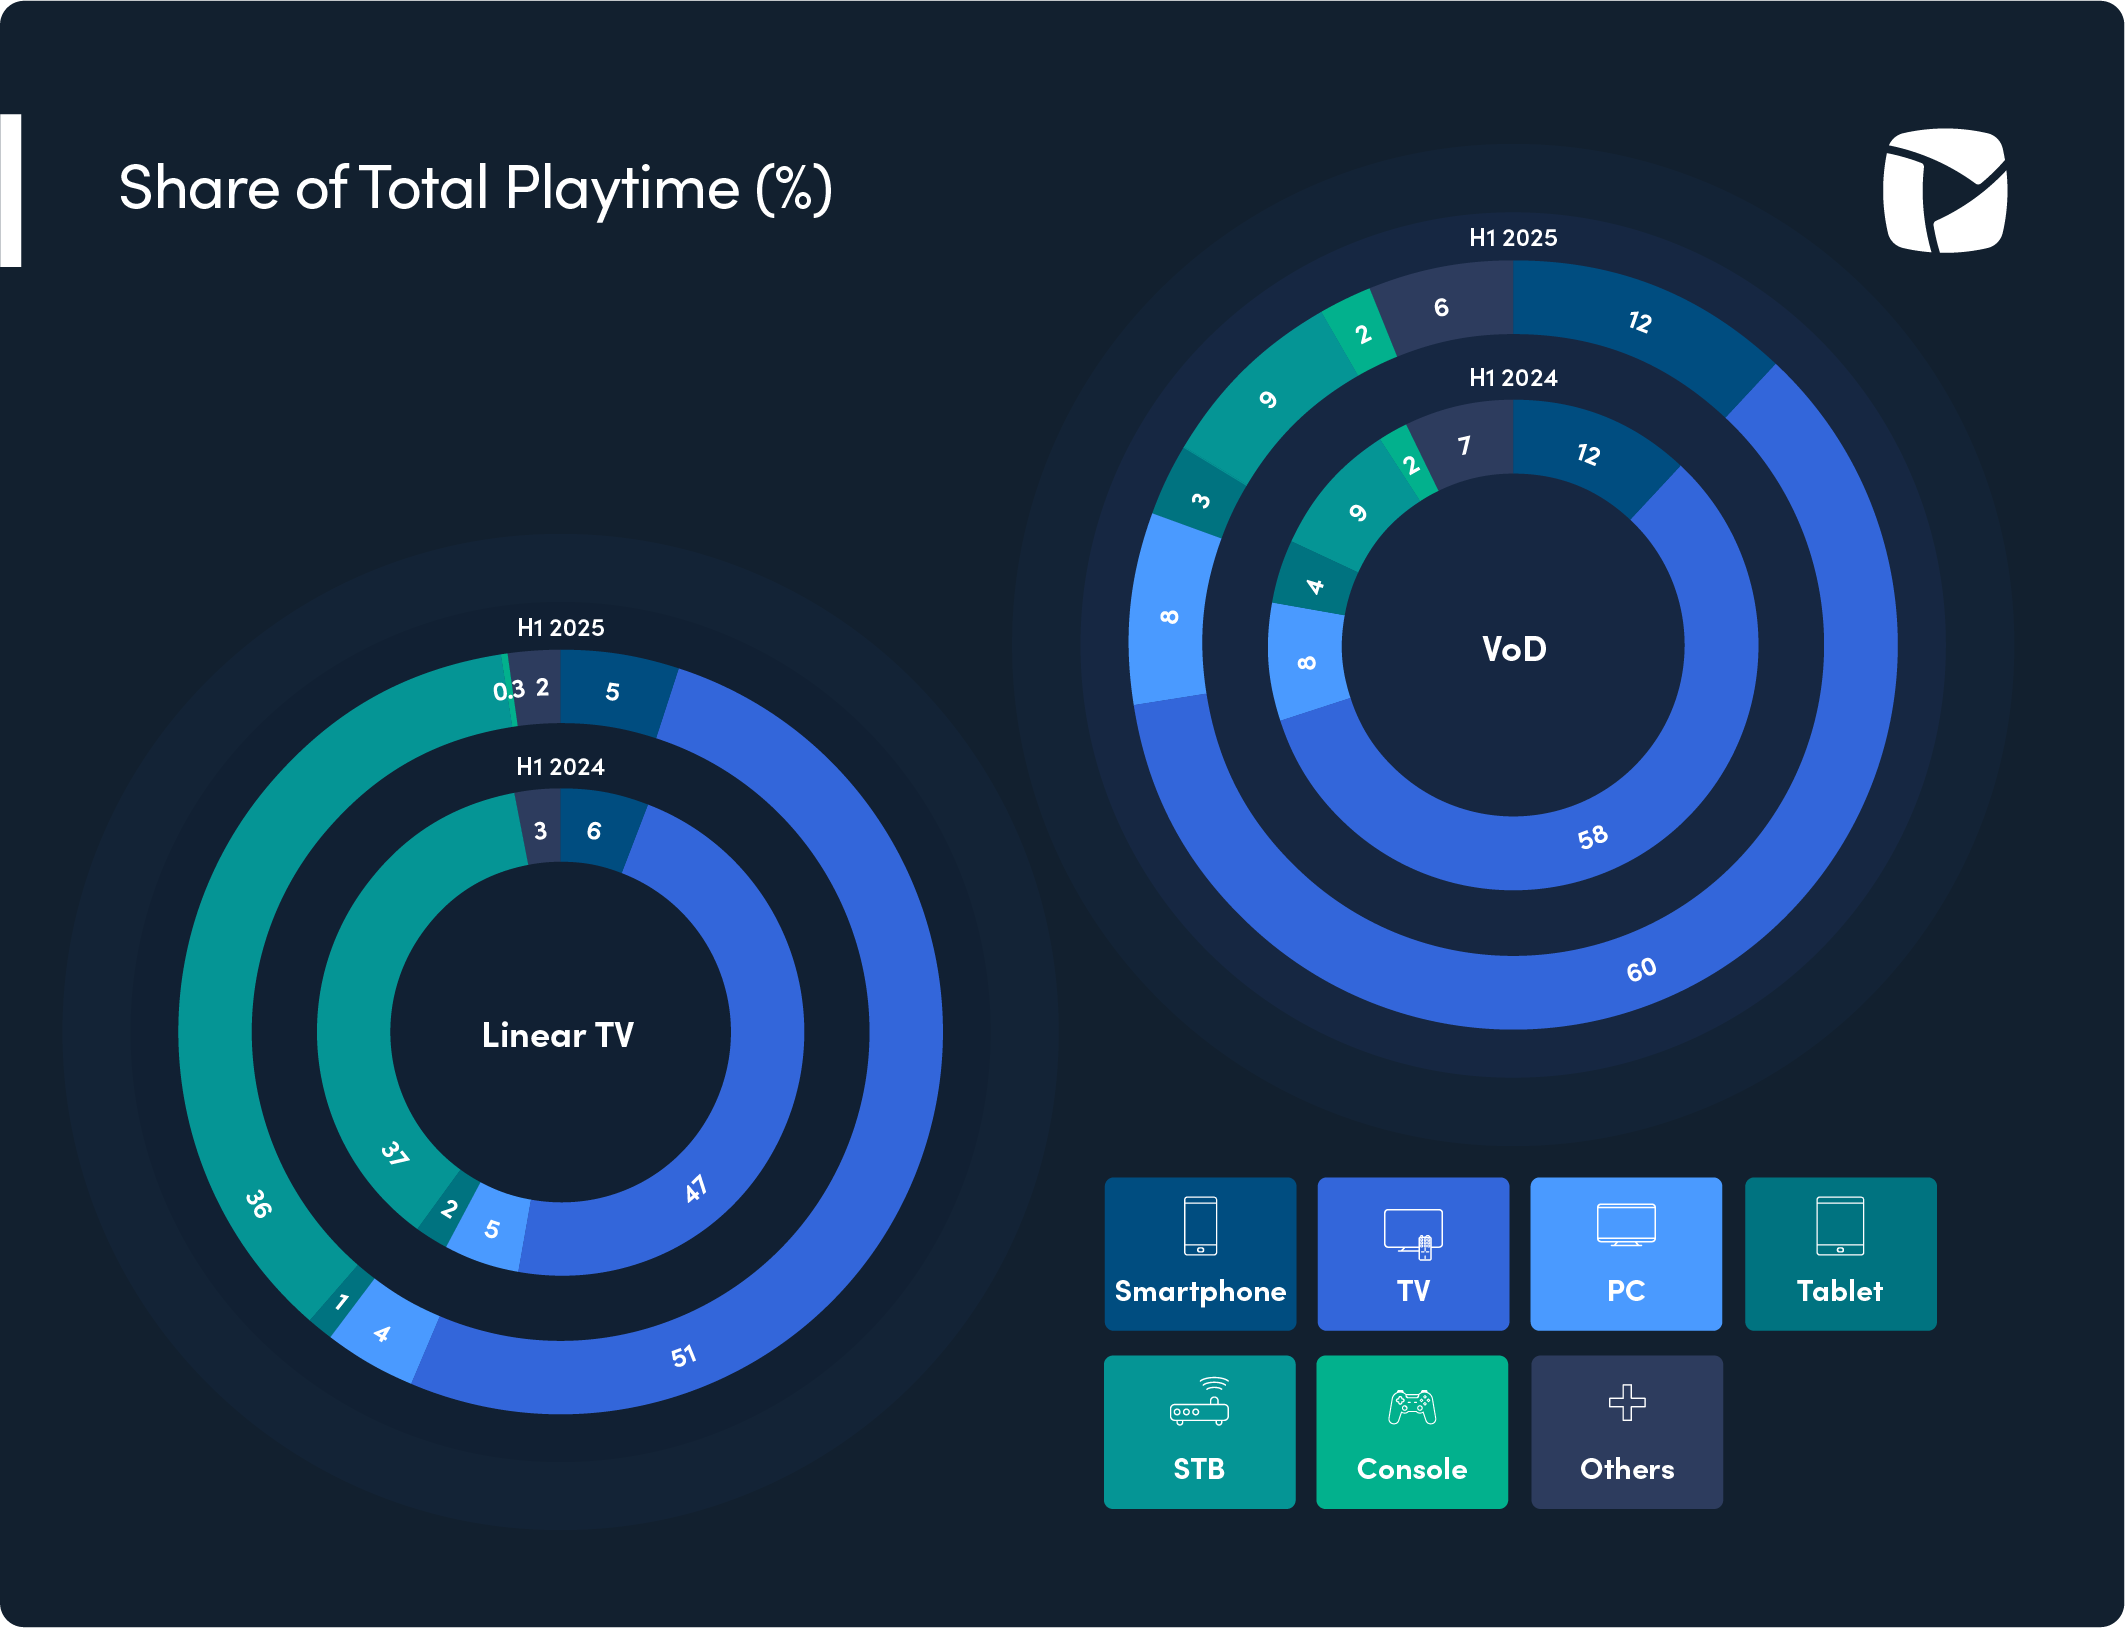
He also pointed out that the data shows "wider adoption of Smart TVs and Set Top Boxes as the devices of choice for viewers, especially when it comes to long format content. Quality metrics on these devices, by and large, are greatly improved over H1 2024. Again, on STBs and TVs, we see greater engagement than on other devices - 69% total for VoD, and an incredible 87% for LinearTV. The majority of viewers are choosing to consume content on the large screen."
The NAPW researchers described the other key takeaways as follows:
- "Global VOD engagement decreases compared to H1 2024 Both avg. Playtime per User and Titles per User per day showed slight dips when compared to last year H1.
- “Global VOD quality is one the rise, in most KPIs Improvements in Avg. Bitrate, Join Time and Buffer Ratio (%) can be seen in almost all regions.
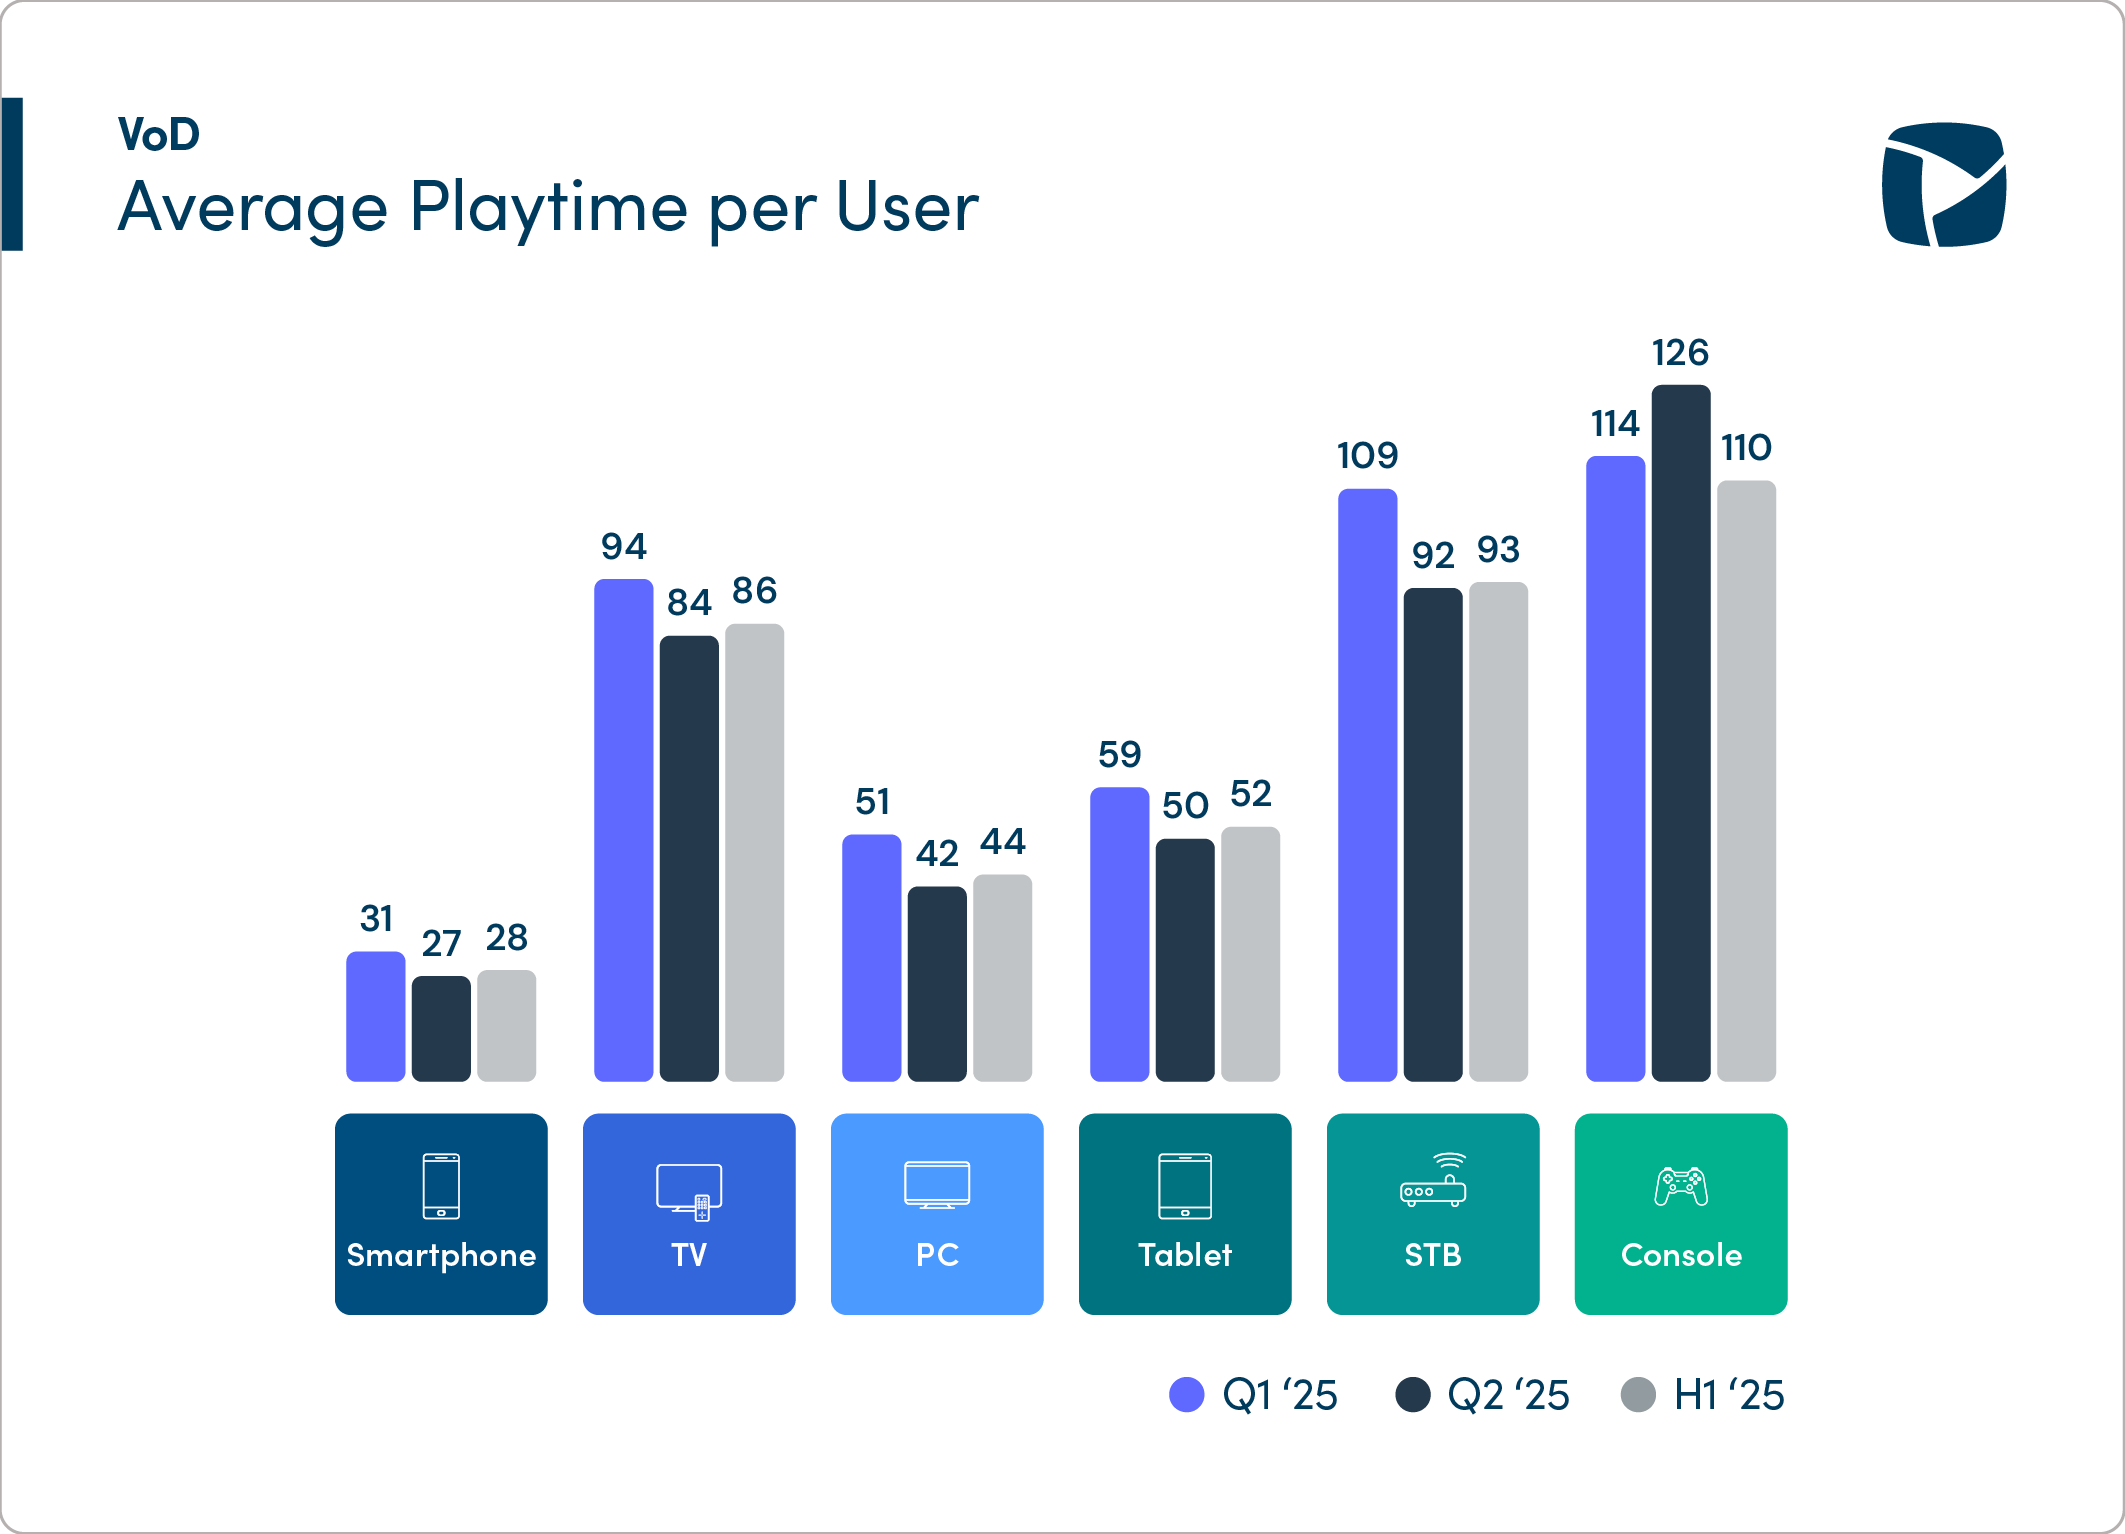
- “Global VOD Device engagement dominated by TVs and STBs Q1 shows the greatest engagement rates, with the highest playtime per user across most devices.
- “Linear TV Global Quality: Shows solid improvements Avg. Join Time, Buffer Ratio (%) and Avg. Bitrate all display major gains, with Join Times decreasing by -16% vs H1 2024
- “Linear TV - Regional Engagement strongest in Europe: The Middle East showed the greatest gains, with 13% uplift compared to H1 2024. Europe leads viewership with over 60 minutes per user per day.
- “Linear TV device share dominated by TVs and STBs: The top 2 device types account for more than 87% of viewership, showing the users prefer the large screen for lengthy viewing."
The full report is available here.
The professional video industry's #1 source for news, trends and product and tech information. Sign up below.
George Winslow is the senior content producer for TV Tech. He has written about the television, media and technology industries for nearly 30 years for such publications as Broadcasting & Cable, Multichannel News and TV Tech. Over the years, he has edited a number of magazines, including Multichannel News International and World Screen, and moderated panels at such major industry events as NAB and MIP TV. He has published two books and dozens of encyclopedia articles on such subjects as the media, New York City history and economics.
