Capturing and Monitoring HDR Signals With a Waveform Monitor
Many of today’s cameras can capture a wide dynamic range that, unfortunately, will be clipped or blown out when shown on a standard dynamic range display. Addressing this problem and allowing High Dynamic Range (HDR) displays to utilize the bits more efficiently to produce more vivid images requires the use of nonlinear processing such as ST 2084 PQ (Perceptual Quantizer) HDR or Hybrid Log-Gamma (HLG) that is compatible with SDR displays.
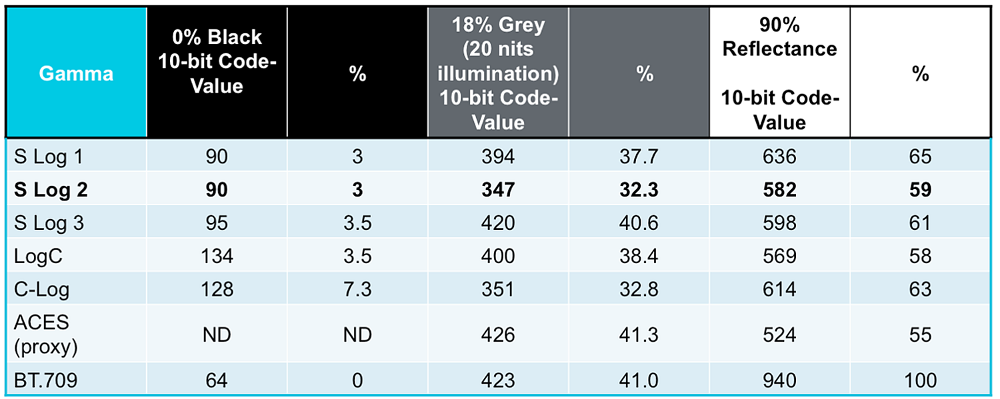
This table shows the appropriate level for various curve types.
Click on the Image to Enlarge
When capturing raw camera images, the best results are achieved when the appropriate levels for black, 18 percent grey and 90 percent reflectance white are set up on a waveform monitor to ensure correct processing of the signal through the chain. The levels required vary depending on the type of camera and the curve applied. Table 1 shows the appropriate levels for various curve types. For example, if you were going to use a camera that captures an S Log 2 curve you would set the white point for 59 percent and the 18 percent grey point at 32 percent.
SETTING UP A TEST CHART
Once you have determined appropriate levels, start by setting up a test chart within the scene using one of the many available charts such as a Spydercube that has areas for 90 percent reflectance white, 18 percent grey, black and sub black. The chrome ball bearing on the top of the cube produces specular highlights from the reflection of the lights in the studio. The lights should be carefully adjusted so that both sides of the cube are evenly illuminated and the camera adjusted to the appropriate levels using ISO/gain, iris, shutter and white balance controls.
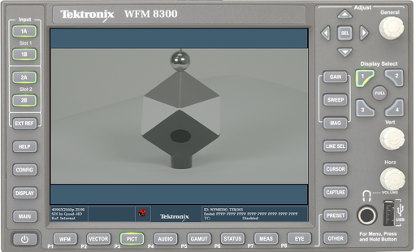
Fig. 1: The S Log 2 camera RAW image looks washed out with low contrast.
The professional video industry's #1 source for news, trends and product and tech information. Sign up below.
Once the lighting and camera are correctly adjusted, the next step is to use a waveform monitor to view the signal as shown in Fig. 1. The picture display of this S Log 2 camera RAW image looks washed out with low contrast. Fig. 2 is an RGB waveform display using a low pass filter to let you see the distinct video levels of the signal.
An easier way to view the signal levels is to use a set of Camera Log graticules that are optionally available on some waveform monitors and can further simplify these adjustments. In this case, an S Log 2 graticule is selected that shows 90 percent reflectance white at 2.3 Stops and 18 percent grey at zero Stops. Alternatively, cursors can be selected to a percentage scale, making sure that 100 percent is equivalent to the zero to 700mv scale. For this S Log 2 signal, the user should place the cursors to the correct white and grey points: the upper cursor would be set to 59 percent for 90 percent reflectance white and the lower cursors would be adjusted to 32 percent for 18 percent grey level.
After capturing the material, the files can be ingested into editing applications and color correction tools to make image adjustments. Using an RGB parade display on the waveform monitor, the black and white levels can be adjusted so that the black level just touches the zero percent scale. The 90 percent reflectance is then adjusted so that the level is at a 100 percent on the waveform monitor for ITU-R BT 709. Then the 18 percent grey should fall at 41 percent on the waveform monitor. It will be necessary to apply color correction processing to the Camera Log content to adjust Lift, Gamma and Gain to correctly balance the image.
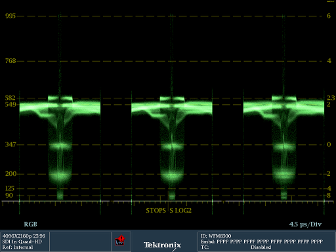
Fig. 2: A waveform monitor with S-Log 2 camera log graticules simplifies adjustments.
Alternatively, most color correction tools can use a look up table (LUT) that can be used as a starting point to grade the material. For this example, an S Log 2 to 709 LUT conversion was performed and then color correction tools can be used to make final adjustments. This process balances the image for a typical 100 nit SDR display. These same types of techniques can also be applied to adjusting content for an HDR display using an appropriate curve to make the transform.
REDUCING NOISE
Depending on the type of camera, you may find that after adjustment, noise will potentially start appearing in the image. This can be reduced by over exposing the image by one or two stops. This limits the dynamic range headroom but also reduces the need for post-production adjustments and the effective noise in the image.
For S Log2 over exposing by one stop will mean that reference white should be captured at 71 percent and 18 percent grey at a level of 43 percent. To do this, you first adjust the levels using an editing or color correction application to reduce the levels of the signal to 59 percent for white and 32 percent for 18 percent grey. Reducing these levels effectively reduces the noise from the camera sensor. Applying the S Log 2 to the 709 LUT produces an image that has white at 100 percent and 18 percent grey level at 41 percent. With this setup, you should notice somewhat less noise in the trace on the waveform monitor compared to the previous display.
RECOVERING SPECULAR HIGHLIGHTS

Fig. 3: This test scene has specular highlights from the coins that may be clipped or blown out in an SDR display.
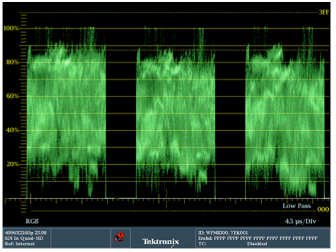
Fig. 4: The paraded RGB display confirms that the test scene in Figure 3 will be clipped or blown out.
The techniques described for capturing camera RAW images were applied to the scene in Fig. 3 to produce a correctly balanced image in the 709 color space for a 100 nit SDR display. However, the specular highlights from the image will be clipped and blown out when viewed on an SDR display, as confirmed by the paraded RGB display in Fig. 4. To recover these highlights in the image, the content needs to be delivered in HDR and the white point must be set appropriately for the image. This can be accomplished by using a ST 2084 or HLG LUT to process the image and make general adjustments before final color correction.
Before capturing the scene, the Spydercube was used to set the reference levels of the camera for S Log 2 for the 90 percent reflectance white and 18 percent grey as described previously and a short clip was captured of the reference content (Fig. 5). Then the scene itself was captured and recorded to a file.
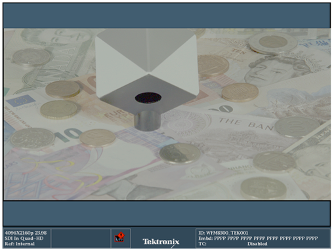
Fig. 5: The Spydercube ensures camera references levels are set correctly. Note that an HDR monitor is needed to view this image properly.
In post-production, a LUT was then used in the color correction software application to change the levels to the 10K ST 2084 PQ curve for a 1,000 nits reference monitor with 100 nits reference white. For our example, we used the camera scene levels of 51 percent for 90 percent reflectance white and 36 percent for the 18 percent grey. The specular highlights in the scene should be adjusted to 75 percent or 1,000 nits on the waveform display as shown in Fig. 6. Slight adjustments were made with the color correction tools to the image using a reference HDR monitor to ensure fidelity of the final image. Many of the software tools for HDR are still in the early stages of development and these tools are continuing to evolve for HDR applications.
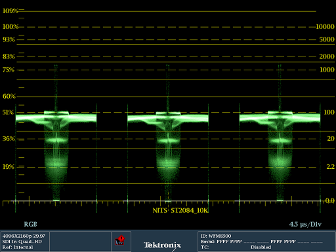
Fig. 6: A waveform monitor is used to adjust specular highlights in the scene to 75 percent, or 1,000 nits.
Many of today’s cameras can capture a wide dynamic range that is typically clipped or blown out within traditional SDR displays. As shown, the available bits can be used more efficiently using nonlinear processing such as S Log 2, ST 2084 PQ or Hybrid Log Gamma. However, it is important when capturing the image from the camera that the correct white point and 18 percent grey levels are set up on a waveform monitor to ensure correct processing of the signal through the chain.
About the author
Educated in England where he received an Honors degree in Communications Engineering from the University of Kent, Mike Waidson started his career with a consumer television manufacturer as a research engineer in the digital video department, before moving into the broadcast industry. Waidson has more than 30 years of experience within the broadcast industry working for various video manufacturers. At Tektronix as an application engineer within the Video Business Division, Waidson provides technical support on video measurement products.
