The professional video industry's #1 source for news, trends and product and tech information. Sign up below.
You are now subscribed
Your newsletter sign-up was successful
It's probably safe to say that one image is synonymous with television, at least from a historical perspective, and that's the test pattern. From the classic "Indian Head" version that was hand drawn back in 1938, to the latest offerings, these works of art are deceptively intricate and combine art with science, and provide a recipe for many hours of enjoyment and debate. When I was offered an opportunity to evaluate the latest DSC Labs Chroma DuMonde camera alignment chart, I jumped at the chance. I knew however, that writing this review would not be easy, as with the possible exception of audio, very few technical subjects are as subjective as a TV camera/test chart/human eye combination.

DSC Labs Chroma DuMonde Camera Alignment ChartFEATURES
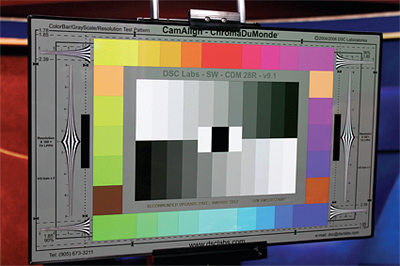
The DSC Labs Model SW-CDM 28R-v9.1 is a 21.25 x 13-inch front-lit broadcast test chart that weighs about 2.25 pounds. It is manufactured on a solid aluminum sheet and has a high quality and rugged front finish. The chart's edges are bordered with a neoprene grommet, which provides a very neat appearance. For evaluation purposes, the chart was shipped with an optional CamStand, which mounts on a standard light-stand. The CamStand is manufactured using Delrin, stainless steel, and aircraft grade aluminum, and positions the chart at an adjustable downward angle to minimize glare. According to DSC, the chart's glossy finish is rugged, will not fade, and is washable with mild detergent.
The chart itself has an 18 percent gray background. The review unit that I received included the company's "Cavi Black" option. This simulates a "super-black" chip with the combination of a dark "cave" that's lined with black felt. This combination provides an area of the chart where almost no light is reflected. On either side of the "Cavi-Black" are 100 IRE white chips. Surrounding the black/white center, there's an 11-step "crossed" gray scale, and surrounding the gray scale region, there are 24 Rec. 709 (ITU-R BT. 709) calibrated color chips, along with four skin tone patches. (It's noted, and evident when viewing on a vectorscope, that the color signals produced by these color chips fall short of the levels observed from 75 percent electronic color bars. However, the chart's chips have been carefully selected to represent real-life colors with middle levels of saturation. The four skin tones are not described in any DSC literature, but range in four increments from light skin to very dark skin.)
Near the top and side edges are frame line markers for aspect ratio and geometric measurement, and also near the sides are hyperbolic resolution "trumpets" with up to 800 TV LPPH (lines per picture height), for checking camera and monitor resolution. Other DSC charts are available with up to 1,200 LPPH.
IN USE
Assembly of the Chroma DuMonde chart was quick and easy. I simply grabbed a light stand and mounted the CamStand on top. Then I slid the chart into the clamp and headed to our main studio. We use Videssence 3200 K fluorescent lights to allow the mixing of artificial illumination and sunlight in connection with an outdoor weather garden.
I tried out the DSC chart on our news set, temporarily removing the anchor's chair and sliding the chart up to the approximate location of our anchor's face. As I framed up the Chroma DuMonde in one of our Grass Valley LDK-4000 cameras, I noticed a bit of glare, but was able to eliminate this with the use of the tilt feature on the chart's mount. After framing and focusing up on the chart, I went to our "tech core" to access the camera's CCU panel.
After adjusting white and black gain controls, I had a pretty decent picture. While viewing the SD signal from the LDK-4000 on our Tektronix WFM601E (an HD verctorscope wasn't available), I was able to inspect the vectors and waveform produced by the chart. I recalled our standard scene-file on the camera CCU and started from there.
From the luminance perspective, the levels were close when I observed things using the monitor's "Parade" display: I adjusted the iris and black gain to get the blacks and whites nearly to the point of compression as we wouldn't want to lose any detail.
For color balance, I selected the "Diamond" display on the waveform monitor, as I find it easiest to use in balancing grayscale. After adjusting things for a straight vertical line, I switched the monitor to display "Vectors." The display I obtained confirmed that the colors on the chart are about "mid-saturated." The vectors looked pretty good, almost forming a hexagon pattern. Using the iris gain to push the vectors up toward the corresponding vector boxes, I was able to change the phase and color correct the colors on the vector scope.
Having adjusted the camera with the chart, I asked a buddy to sit at the talent chair so that I could evaluate the picture. When I viewed the picture monitor, the image seemed to have an overall bluish tint. I then tried recalling the stored scene file and this returned the image to my original starting point. You can tell the difference in the tint, as the vector in the photo labeled "Preferred file setting," as it moved everything a bit to the "warm" side (red).
I was pretty sure I knew what was going on, but thought it might be a good idea to call DSC Labs for a bit of confirmation and some educational pointers.
DSC's David Corley was most helpful, and as a true scientist, he enjoyed talking shop. In our conversation, he reinforced the idea that charts just provide an even playing field to use as a starting point. Each lighting condition has its own subtleties; human eyes are not camera lenses, image sensors, or vectorscopes. After speaking with David, I was then able to completely misadjust all three of our studio cameras, and then by using the Chroma DuMonde chart, repeatedly realign them to a point that was almost indiscernible from the setup information recalled from the scene file.
According to the DSC Website, a glossy finish has more dynamic range, but in some multiple camera situations matte charts may be preferable. For that reason, CamAlign charts are available in matte finish by special order. I should note, however, that matte charts cannot be cleaned or washed, and may be easily damaged.
SUMMARY
The CamAlign Chroma DuMonde is a professional product all the way. When ordering such a chart, you need to make sure you get the resolution "trumpets" to match your facility (either 720 lines or 1080 lines). I can't say enough about how knowledgeable the folks at DSC are. I've been maintaining cameras for almost 30 years, and I thoroughly enjoyed the "Charts 101" posting on the DSC Labs Website. I know that they will be my go-to company when I have to deal with "the unexplained" concerning cameras from now on.
Joey Gill is chief engineer at WPSD-TV in Paducah, Ky. and has been with the station for 30 years. He has worked in television since 1977. He may be contacted at respond2jgill@yahoo.com.

The professional video industry's #1 source for news, trends and product and tech information. Sign up below.
