The professional video industry's #1 source for news, trends and product and tech information. Sign up below.
You are now subscribed
Your newsletter sign-up was successful

The Sarnoff Digital Test Pattern When I was approached about evaluating the Sarnoff Digital Test Pattern, my interest was piqued immediately. After all, it's been a long time since most of us have used anything other than good 'ole "NTSC color bars" as a test pattern. As television technology has changed, so has the role of the test pattern. In past decades, broadcast cameras by themselves required a surfeit of test patterns and charts to assist engineers in achieving any level of acceptable performance. With advances in technology, and the acceptance of file-based workflows (including content acquisition, editing, processing, storage and now file-based distribution to the home), most of us have moved to stream analyzers/monitors and IP test tools. Broadcasters have really not had much to choose from in the test pattern world. Color bars were relegated to setting up monitors, and really only provide confirmation that video is present.
While broadcasters have been scrambling to understand and implement DTV, the staff at Sarnoff Corp. has been looking a bit further ahead by developing test patterns that apply to DTV and beyond. Their latest offering, The Visualizer, is enticing, to say the least.
FEATURES
The Sarnoff Visualizer is a license-by-site product, and the standard product package includes 1920x1080, 1280x720, and SD test patterns. It's available in 29.97 and 25 Hz versions, and custom formats can be delivered in any size, frame rate, or color space at bit depths of up to 16 (48 bits per pixel).
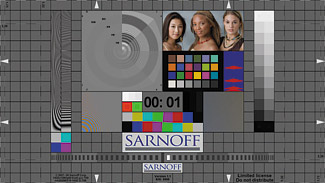
Very little real estate is unused on the resulting test pattern display, as the pattern is feature packed.
Those unused portions are marked off in grey (and contain noise to challenge encoders), squares with a black border (noise-free) and are provided with both vertical and horizontal arrows to mark the image extremes. (The arrowheads' length is five percent of the overall picture height.) The noise level generated is 27 dB in the center, and this decreases by 0.5 dB per grid square as you measure horizontally away from the center. Circumnavigating the chart is what's called the Marquee. This is a single-pixel-wide dashed white line that crawls around the edge of the picture and confirms the presence of every pixel mapped to the screen. The center of the pattern contains four 100 percent (level) white pixels.
The pattern's moving-block lip sync feature allows measurement of lip sync offset and has a resolution of one field. The same pattern allows easy detection of video field dominance reversal, chroma field dominance reversal, interlaced luma with 4:2:0 progressive chroma, caption sync errors and chroma motion judder. In addition, there is a lip-sync blinker to allow measurement of lip-sync offset using a photo detector-based instrument.
The Compression Fidelity Pie feature provides a numerical measurement (visually) of the amount of compression that has been applied to the signal in units of Lines per Picture Height (LPH) and Bit Depth. There's also the Chroma Zone Plate, which indicates chroma resolution—4:2:2, 4:2:0, 4:1:1, and so on. The color bars provided have a twist in the center, which allows verification of 4:2:2 and 4:2:0 upsampling. The "Blue Only" section provides users with the familiar white/cyan/blue/magenta squares of SMPTE bars, and allows calibration of chroma phase/gain. Various sweeps are provided, including the moving pattern above the Blue Only, which is a pair of frequency sweeps—one for horizontal frequencies and the other for vertical frequencies. These allow measurement of frequency rolloff, scaler performance and aliasing performance.
Color Matrix Mismatch can be detected using the red and green squares to the left of the counter, which have a darker square inside. If the dark square disappears from the green square, this means that the signal was created in an HD matrix and decoded with an SD matrix. The indicated situation is reversed if the dark square disappears from the red square.
The White Pluge feature allows you to set a monitor's contrast to maximize its dynamic range and there's a normal (black) pluge as well.
Unique to the Visualizer is a Fleshtone Reference. There is an image of three women with differing skin tones, and for color reference there's a SMPTE RP-303M color chip chart included. Both the chip chart and the women are carefully color-managed for gamma and primaries. There's a Lava Lamp pattern to confirm the presence of smooth motion rendition, check progressive scan conversion, check 4:2:0 interlaced chroma subsampling and for detection of non-continuity in signals. There's also a counter for labeling each frame/field and to confirm drop-frames and freeze frames. An optional Closed Caption Sync feature provides confirmation of video/CC timing.
IN USE
It's not often that products for review arrive in an envelope. However that's the way the Sarnoff Visualizer DVD-R was shipped—in a large manila envelope with a neatly bound manual and laminated quick-reference card.
I should mention too that there's also a tutorial included on the DVD-R, which has the test pattern playing at the top of the screen, and each feature is demonstrated below as you scroll down. As you move to each topic, there is a drop-down selection dialogue box that allows you to create different scenarios. For example, in using the Chroma Sweep check, you can select either 4:2:2, 4:2:0, or 4:2:1. As you select each choice, the corresponding test area displays how that feature would work under those conditions. This browser-based training tool proved invaluable as a training aid.
After loading the files on my PC, I could hardly wait to view the test chart. Due to HD on-air requirements at our facility, my first look at the Visualizer would have to be in SD, and for the first time I realized that ours is truly becoming a high-definition world.
I copied the 720x480i file onto my thumb drive and by using an Edius editor on PC platform, I was able to easily load and play the SD file. By referring to the included laminated reference card, it became very clear that I was actually making technical measurements with nothing more than a video monitor.

One of the first observations I made was that the monitor itself needed calibration. By using the pluge patterns I was able to adjust the contrast and brightness into proper alignment. The Compression Fidelity chart showed full detail out to 480 LPH and down to one level in 256 – not surprising since I was viewing the uncompressed original. The Chroma Zone Plate indicated the expected 4:2:2 color sampling and the Shallow Ramp verified that I was seeing full 10-bit encoding. The Color Mismatch Indicators verified that the monitor was indeed using an SD matrix to display this SD version of the pattern. The A/V lip-sync proved to be "right on," as the "tick" sound produced by the Sarnoff pattern occurred just as the center line lighted. (If the moving mark is anywhere else besides the center spot when the sound is heard, lip sync is off.) As I stared at the moving line, it became easier to just fixate on the lighted mark, and surprising accuracy could be achieved by just "eyeballing" the pattern. (The staff at Sarnoff suggests closing in on the white mark with a couple of business cards from either side.) Finally, I could see absolutely perfect flesh tones on the beautiful models at the top of the pattern.
Later in the week, I found an opportune time to try out the Sarnoff Pattern in HD. Our native studio HD format is 1920x1080i. The test pattern provided was only 10 seconds in length. However, due to fact that most file playback platforms offer a "loop" playback function, a longer length is not really needed. For playback in HD, I'd planned to use our Grass Valley K2. However, the K2 does not recognize the test pattern's .avi file format, so it was back to the Edius editor, where I was able to transcode the file to MPEG HD format for K2 playback.
I'm not sure if any quality was lost in the transcoding process, as the pattern absolutely knocked my eyes out when viewed on the HD monitor. Not only was I able to use all of the previously described test pattern functions, but when I examined the representations of the three models for skin tone and clarity, I was astonished by the detail visible in their jewelry. By using the Compression Fidelity chart I was able to discern that my resolution was just above 900 lines. None of the parameters that the Visualizer measures seemed to be harmed by the transcoding process, as the display passed all the tests.
SUMMARY
The Sarnoff Visualizer is designed for quick testing of a video chain, not for ensuring strict ATSC bitstream syntax compliance. For real world evaluation and troubleshooting, it's definitely a fine piece of work by some people who knew exactly what they were doing. Just by using the Visualizer for a few minutes taught me things I didn't know about digital television. The test pattern's price point kind of stings at first, but no engineering department would have flinched 20 years ago at paying more (price adjusted for inflation) for a bench quality test generator. And unlike some complicated test gear in the past, the learning curve on this piece of gear is incredibly short and results are obvious.
Joey Gill is the chief engineer at television station WPSD-TV in Paducah, Ky. He has been with the station for 25 years and has worked in broadcasting since 1977. He may be contacted atrespond2gill@yahoo.com.
The professional video industry's #1 source for news, trends and product and tech information. Sign up below.
