The professional video industry's #1 source for news, trends and product and tech information. Sign up below.
You are now subscribed
Your newsletter sign-up was successful

One of the challenges broadcasters face in rolling out Mobile DTV (MDTV) is determining mobile coverage. Techniques used for calculating and measuring coverage to outdoor antennas don't account for the wide variety of environments where mobile and handheld devices are used.
CALCULATING COVERAGE
This month I'll look at the challenges calculating DTV coverage and offer some options for measuring it, including a very simple and innovative solution from Charles Cooper, consulting engineer at du Treil, Lundin and Rackley.
I've described limitations of the Longley-Rice propagation model in the past. Sid Shumate's analysis of Longley-Rice shows how it "smears" coverage over obstructions. My field tests confirmed this.
Signal strengths in the shadows caused by terrain obstructions were much lower than those predicted by Longley-Rice. This has implications for on-channel repeater/DTS design because studies based on Longley-Rice are likely to predict interference in locations where there was no reception even before the repeater/DTS was added.
Another problem with most Longley-Rice studies is they ignore buildings, which can have a significant impact on MDTV coverage. As can be seen in the maps in my November 2009 article on digital on-channel repeaters, use of the shuttle radar topography mission (SRTM) elevation data improves accuracy, but only for large buildings in place when the data was collected in February 2000. More up-to-date 3D models of buildings in major cities are available in Google Earth, but other than SRTM, I'm not aware of building data being used in off-the-shelf software sold for broadcast coverage studies.

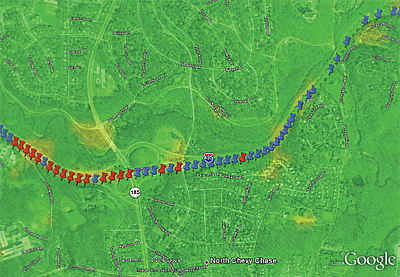
Fig. 1: Longley-Rice Map With DTVi Measurements An alternative to precisely modeling every building and obstruction at resolutions fine enough to show their impact is to calculate coverage based on the average height and density of buildings in an area. The latest version of SPLAT (1.3.0) allows users to input a fixed clutter height although the current Longley-Rice implementation limits its usefulness.
ITU-R Recommendation P.1812 notes that there is no standardized set of clutter categories, but recommends using clutter heights of 10 meters for open/rural/water and suburban areas, 15 meters for urban/trees/forest areas, and 20 meters for dense urban areas. The ITU-R P.1812 propagation model (which I understand is the basis for TIA-TSB-88) appears to be an excellent way to accurately predict MDTV coverage.
The Okumura-Hata propagation model uses clutter data and is more readily available in off-the-shelf propagation software. As with any propagation model, the accuracy of the output is no better than the accuracy of input data. A Google search on—"Doug Lung" propagation models—will bring up links to articles I've written that cover propagation models in more detail.
MEASURING COVERAGE
Practical propagation models have their limits. Field testing is the best way to determine actual coverage and is useful to validate modeling. I've previously discussed the small test vehicle built by MSTV that's been used nationwide to measure MDTV coverage.
I'll describe two ways individual stations can assemble their own vehicles for MDTV measurements. MDTV measurements are much easier to do than FCC field strength measurements for fixed reception. The antenna can be mounted on a vehicle that's driven through the area to be measured without the need to stop and erect a 30-foot mast. Measurements of pedestrian and indoor coverage are much more difficult. The simplest approach may be to use data available on building penetration loss combined with vehicular signal-strength measurements to extrapolate in-building coverage.
The fastest and easiest method I've found for collection of MDTV field data is the DTV Interactive AFT-700 drive test set with the AFM-500 software. The AFT-700 includes a professional ATSC A/153 USB powered receiver in a well-shielded metal enclosure; USB GPS receiver module; magnet mount vertically polarized receive antenna; and a Windows XP-based laptop with custom software.
The AFT-700 software has boxes displaying signal characteristics; live video/audio from the stream; a map showing signal quality (nothing, low, medium or high) per measurement point; and a log with data for every measurement point.
The AFT-700 records data in an XML file. For each point, this file contains the received SNR, signal strength in dBm, latitude and longitude, vehicle speed, data and time. The AFM-500 software allows processing of this data to combine multiple runs (same or different areas).
The program can display coarse signal information on a map and allows exporting the data to a KML file for viewing it externally in Google Earth. This is handy because you can overlay the measurement data with, for example, a SPLAT-generated coverage map of the area.
I've included an example of this showing calculated and measured coverage along the beltway in Washington, D.C. Fig. 1 shows the areas in green where the signal was predicted to be above 88 dBµV/m at an antenna height of 3 meters. The coverage study used Longley-Rice and SRTM topographic data. The pins show measured signal, with red being worst and blue being best.
Unfortunately, at the prices I've seen, it will be difficult for stations to purchase their own AFT-700/AFM-500 equipment for individual use, although station groups could purchase one unit for multiple stations because its portability makes it easy to share. The AFM-500 requires a USB hardware key, but the files it generates are in plain text .xml or .kml so they can be used on any computer. Advanced users may want to use their own software to create maps and extract data.
DIY MEASUREMENTS
Charles Cooper came up with a less expensive way to measure MDTV coverage. It won't provide data on received signal SNR or signal strength without additional equipment, but is a very easy way to locate areas with reception problems.
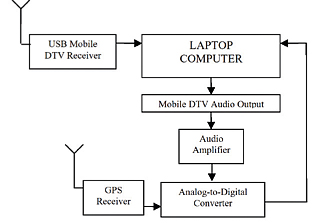
Fig. 2 shows the block diagram of the system. The operation is simple: A National Instruments USB6008 is used to monitor the audio from the MDTV receiver. When the signal is present the MDTV received audio is present. When the audio goes away, the vehicle has moved into a bad reception area. Transmitting a tone will make detection easier and provide more accurate results than detecting program audio.
Cooper doesn't describe the software he used. The simplest approach would be to use a program like LabView to grab the GPS data (location and speed) and the audio status (present or not) at selected intervals. A cheaper but somewhat more complicated approach would be to use an existing map program to record the GPS way-points at a certain time or distance interval and use a free program like the Pira CZ Silence Detector to log outages. A PERL script, spreadsheet or database program can be used to combine the audio presence data and the GPS data for import into a mapping program.

Fig. 2: Functional Block Layout of MDTV Drive Test System If a spectrum analyzer is available with a computer interface, it can be used to collect the signal's channel power data. A field strength meter could also be used. The Z-Technology DVS5100 drive test system should work well as it includes a GPS. Do not use a device that depends on locking to the 8-VSB signal as it won't work in most mobile environments. For the most accurate results, the audio data, GPS location and, if used, signal strength data should be collected at the same time.
Calculate percentage coverage in segments along the route to compare coverage from different stations or to track the impact of changes in the transmission system. Cooper divided the route into 2,500 foot segments and analyzed reception in each segment. In his white paper he describes how to do this: "If 95 percent of the measurements had successful reception, then that line segment is classified as excellent with a green color; if between 75 percent to 95 percent of the measurements had successful reception, then that line segment is classified as marginal with a yellow color; if fewer than 75 percent of the measurements had successful reception, then that line segment is classified as poor with a red color. The data is defined by one-second time internals, with culling of the measurements having the same location (for example, if stopped at a traffic light)."
I've posted a copy of the paper at http://xmtr.com/rf204/Mobile_DTV_Testing_System_Generic.pdf. Contact Charles Cooper at CHARLES@DLR.com for more information on MDTV coverage measurement and model studies.
Let me know if you put together your own system for MDTV drive test measurements. I'd be interested in the data collection software and routines used to analyze and plot the data. Availability of MDTV receivers is still limited, but as units make it through the FCC certification process we should start seeing some appear on the market later this summer. Systems can be tested using conventional ATSC receivers, but obviously won't show much coverage unless driving very slowly or in an area with few reflections.
Comments are welcome! E-mail me atdlung@transmitter.com.
The professional video industry's #1 source for news, trends and product and tech information. Sign up below.

Doug Lung is one of America's foremost authorities on broadcast RF technology. As vice president of Broadcast Technology for NBCUniversal Local, H. Douglas Lung leads NBC and Telemundo-owned stations’ RF and transmission affairs, including microwave, radars, satellite uplinks, and FCC technical filings. Beginning his career in 1976 at KSCI in Los Angeles, Lung has nearly 50 years of experience in broadcast television engineering. Beginning in 1985, he led the engineering department for what was to become the Telemundo network and station group, assisting in the design, construction and installation of the company’s broadcast and cable facilities. Other projects include work on the launch of Hawaii’s first UHF TV station, the rollout and testing of the ATSC mobile-handheld standard, and software development related to the incentive auction TV spectrum repack. A longtime columnist for TV Technology, Doug is also a regular contributor to IEEE Broadcast Technology. He is the recipient of the 2023 NAB Television Engineering Award. He also received a Tech Leadership Award from TV Tech publisher Future plc in 2021 and is a member of the IEEE Broadcast Technology Society and the Society of Broadcast Engineers.
