HDR and the Science of Color
In several of my past posts, I’ve referred to Wide Color Gamut (WCG) and indicated that you can’t talk about HDR without also talking about WCG. It’s time for us to discuss that in more detail. As always, this is not intended to be an in-depth discussion – just enough to give you the ammunition you need to understand WCG as it relates to TV, or to give you a launching point for your own research.
DOCUMENTING HUMAN PERCEPTION OF COLOR
Academics have been studying human vision for quite a while, and several systems have been developed to attempt to describe it in precise terms – such as the Munsell color system, which was first published in 1905 and is still in use, in an updated form, today – largely for color matching. Like many other systems, the original “Munsell Atlas Of Color” dealt with relatively few hues, which limited its widespread adoption. The most well-known of these systems today is the CIE 1931 color space, which is the incumbent color space for the film and television industries.
CIE 1931 – THE STANDARD COLOR SPACE
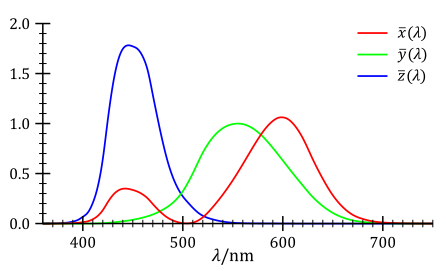
In 1931, the International Commission on Illumination (abbreviated to CIE from the French version of the name), created a pair of color space definitions based on a series of experiments to establish links between perceived colors and their wavelengths in the electromagnetic spectrum – specifically the responsiveness of cone cells (for a more detailed description of cone cells, see my previous post “how we see: the human visual system”). The results were then weighted and tabulated into a “tristimulus graph” of an average person – known as “the CIE Standard Observer” –and is shown in Fig. 1.

Don’t let the term “tristimulus” disturb you – there are many ways of describing light in tristimulus values: R,G,B and even Y,U,V are examples that we use every day. In the case of CIE color space, the terms used are X, Y & Z, which are derived from each of their respective curves in Fig. 1. Without going into huge detail, Y in this system is generated from the y(ƛ) color matching function and is the luminance component. X, not surprisingly, is generated from the x(ƛ) color matching function, and Z is generated from the z(ƛ) color matching function. The amplitudes of all three of these functions are always non-negative and are proportional to intensity.
You should also note that these curves are not definitive – different people will have slightly different distributions than those shown in the Standard Observer chart. In fact, the original research that ultimately produced the CIE color space only used 17 test subjects!
The professional video industry's #1 source for news, trends and product and tech information. Sign up below.
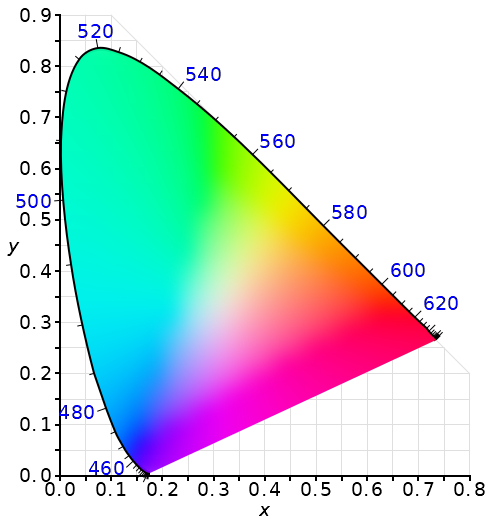
In order to create a graph of the CIE color space, we can now create 2 chromaticity values from these tristimulus parameters as follows:

We now have our X and Y axes for the graph, which is now the well-known “CIE horseshoe” shown in Fig. 2. Two things to note here: (1) the locus (the outside path shown as a black line) indicates the c and g coordinates for a monochromatic source as its wavelength is tuned from 400nm to 700nm, and (2) there is no line at the bottom of the graph. Anything outside of the horseshoe-shaped region is not a visible color.

STANDARD COLOR GAMUT FOR TV
We now have a model that shows the full color spectrum as perceived by the Standard Observer. Practical limitations in technology mean that we can only process and deliver a subset of that color space. In normal HDTV, the transmittable color space was defined by an International Telecommunications Union (ITU) recommendation ITU-R BT.709, more commonly known as “Rec 709”.
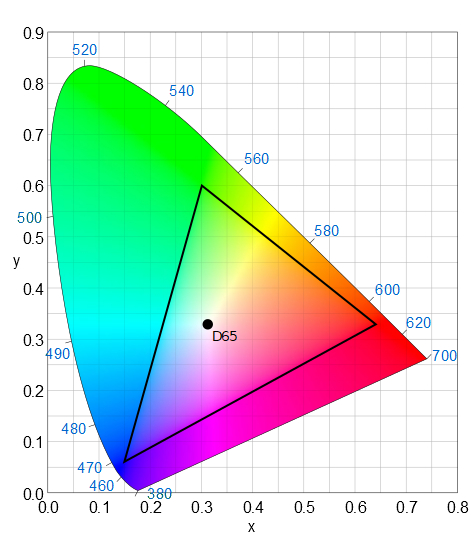
The term for the legal color space is “gamut;” any color that is outside of this defined color space is termed “out of gamut.” What a system or display will do with an out of gamut signal is not defined, though in many cases, it will just result in clamping to the legal limit. Really bad things can happen with seriously out of gamut signals, though, so a great deal of effort is put into keeping signals within the legal values. Fig. 3 shows how much of the CIE space is actually legal in Rec 709.

The dot in the center of the diagram labelled D65 simply details the illuminant declared to be flat white. As you can see, there are large areas of the CIE color space that are outside the range of Rec. 709. This means that there are a significant set of colors that simply can’t be reproduced on an HDTV system. We really need to do better!
WIDE COLOR GAMUT AS IMPLEMENTED IN HDR
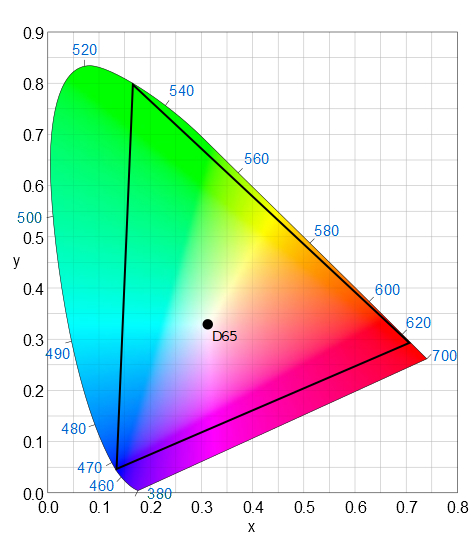
Now let’s take a look at the color space that is available through an HDR path. The specification here is BT-R.2020, commonly referred to as “Rec 2020” or simply as “BT.2020”. Fig. 4 shows how that relates to the CIE space.

Clearly, there are many more colors that can be reproduced. In particular the range of red and green colors is substantially increased.
This much wider range of reproduceable colors is a significant factor in the impact that HDR television brings to the presentation of video. Not only are colors more vivid, but they are also more nuanced.
Paul Turner is founder ofTurner Media Consultingand can be reached atpault@turnerconsulting.tv
Other articles in this series:
Candelas And Lumens And Nits – Oh My!!
