Cameras Record ‘Big Data’ for the NBA
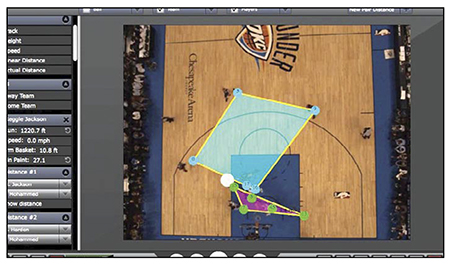
An analysis screen showing some of the data generated by STATS NEW YORK—The National Basketball Association is deploying STATS’ SportVU player-tracking cameras in all 30 of its stadiums this season. The full league rollout follows three years of testing, plus experience gained from current SportsVu camera deployments in 15 NBA arenas.

The STATS system provides coaches, trainers, scouts, media and fans with accurate, labeled tracking of each player and the ball during game play. The historical data captured from six SportsVU cameras deployed in each equipped arena is algorithmically processed to create a real-time animation of everything that happened on the court. This data also provides rich statistical breakdowns of player performance, statistics, and positions; both for use during the game (on scoreboards, NBA.com and NBA TV) and afterwards by coaches, trainers, and scouts.
“The owners who operate NBA teams are also in business, and they understand the value of Big Data,” said Steve Hellmuth, the NBA’s EVP of operations and technology. “STATS SportVU brings the power of ‘big data’ to major league basketball, by filling all the gaps related to player performance, effective on-court tactics, and in-depth statistics compilations and analysis.”
25 IMAGES PER SECOND
At the heart of the STATS SportVU tracking system are six hand-sized SportsVU video cameras. These are installed up in the catwalk over an NBA court floor. There is a camera mounted in each end zone, plus two pairs of cameras mounted near the corners on one length of the court.
“By capturing 25 images each second, these cameras capture real-time video plus positioning data on each moving element on the floor,” said Brian Kopp, STATS’ senior vice president of sports solutions for STATS, a Chicago-based sports technology, data and content company. “Using data entered before the game, the system can accurately follow the X/Y [left-right , front/back] position of each person in real-time. The system also tracks the ball in X, Y and Z [height] axes.”
A local operator is on hand at the game site to oversee the equipment, however, the actual data is ported to STATS’ headquarters in Chicago, where it is processed into a 2D animation, and posted on a password- protected Web site for access by approved team staff and media.
The professional video industry's #1 source for news, trends and product and tech information. Sign up below.
The resulting animation is, from an analytical point of view, nothing short of stunning. The actual movement of the ball and the players can be viewed in real-time, plus paused and advanced either forwards or back to see how plays developed. But that’s not all: The STATS SportVU system can quickly use this data to update performance statistics for each player at a level hitherto impossible.

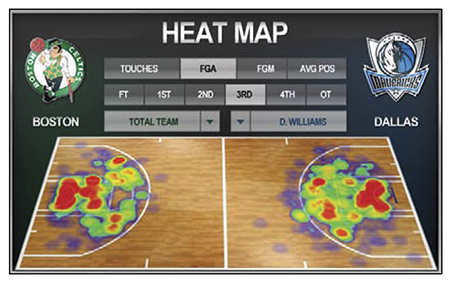
In this “heat map,” the colors indicate the level of player activity in certain areas of the floor, with red being the busiest areas. “We can see how long each player got the ball, and how well they performed from a range of different positions,” said Hellmuth. “We can also see how moving defensive players around the court affects the response of offensive players; a valuable piece of information for coaches wanting to boost their defense’s effectiveness.”
STATS SportVU can even extrapolate which areas of the court were the busiest, representing the differences in different colors. At a glance, coaches and analysts can “see” how a particular play evolved, and break its evolution down to the nth degree.
There’s even more. “You can use the tracking data to measure changes in players’ speeds as they get tired, to assess the impact on the game, and to suggest what kind of stamina training might be in order,” said Kopps. “In fact, you can use the STATS’ data to ask all kinds of questions, simply because the complete game play history is at your fingertips.”
LEVELING THE PLAYING FIELD
The NBA’s decision to take STATS league-wide is driven by a sense of competitive fairness. “Teams who already have STATS SportVu have a significant strategic and marketing advantage over those that don’t,” Hellmuth explained. “By making sure that everyone uses this technology, we’re leveling the playing field—while ramping up the quality of play for our fans.”
That said, the rich data generated by STATS SportVu for both coaches and fans makes it a natural for other sports. In fact, European soccer clubs have been using this kind of tracking technology for the past five years, with STATS’ own system being derived from that model.
“Our next goal is to apply STATS Sport- VU to hockey,” said Kopp. “We can see this sport benefitting the same way that the NBA has, by getting access to a big data overview of gameplay. From there, we’ll just have to see what happens next.”
James Careless is an award-winning journalist who has written for TV Technology since the 1990s. He has covered HDTV from the days of the six competing HDTV formats that led to the 1993 Grand Alliance, and onwards through ATSC 3.0 and OTT. He also writes for Radio World, along with other publications in aerospace, defense, public safety, streaming media, plus the amusement park industry for something different.

