Laboratory Simulations of a Single Frequency Network
The professional video industry's #1 source for news, trends and product and tech information. Sign up below.
You are now subscribed
Your newsletter sign-up was successful
At the recent IEEE Broadcast Symposium, Mark Aitken, director of advanced technology for Sinclair Broadcast Group, presented a paper concerning the echo rejection of 16 different models of NTIA-approved "converter boxes" by simulating a single frequency network (SFN). This is still a work-in-progress as many other tests are planned by myself and my colleagues.
For our tests, Rohde & Schwarz loaned us a model SFE DTV signal generator for which we are extremely grateful. It can provide 12 copies of a test signal, which, alone makes it invaluable for simulating SFN echo rejection of ATSC receiving appliances.
We use "converter boxes" as we have means to distribute the test signal to 16 units under test at one time. It also can provide calibrated phase shift for each copy of the test signal and it can also provide dynamic echoes, but that we will save for a later column.
Can you imagine trying to detect which of the 16 receiving devices under test (DUT) has failed to decode the audio signal encoded in the ATSC signal? No, we couldn't either and we had found that in some cases, failure of the audio is the best way to determine the conditions under which one or more devices under test have failed.
Rohde & Schwarz cleverly allow the option of an unmodulated 400 Hz tone to accompany the ATSC picture signal output of the SFE. I built a 16-channel visual audio frequency VU Meter so we can monitor each DUT without the distraction of hearing any audio.
OK, so what have we learned so far? Those who attended Mark's presentation know, but for the rest of my readers, I'll briefly review this test data.
These tests involved one or two echoes. The Single Static Echo tests measured the desensitization of each DUT under identical conditions as we varied the total RF signal power (which includes a strong echo) for a set of (D+E)/E ratios: 1 dB, 3 dB and 6 dB as we varied the echo delay over a wide range.
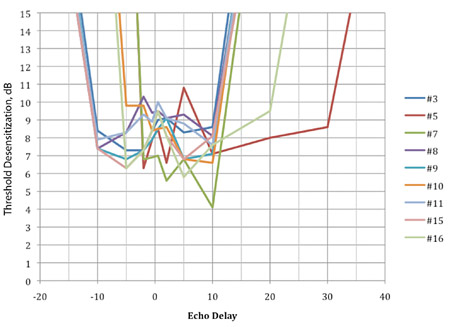
Fig. 1: Desensitization of the 16 NTIA-approved “converter boxes” tested by the author. This figure is 1 dB below the power of the signal, D/E = 1 dB. For the strongest echo, (1 dB below the D signal), the desensitization was measured from –5 dBm (a leading echo) to +30 µS (a lagging echo) as shown in Fig. 1. All other units had a smaller range. Beyond this range, the units under test failed to decode both audio and video.
For a (D+E)/E of 3 dB, the range of echo delays for one unit was greater; –2 µS to +50 µS as shown in Fig. 2. The range was even greater for (D+E)/E = 6 dB as shown in Fig. 3. The range of one unit was measured from –20 µS to +70 µS. All other units had a smaller range for (D+E)/E = 6 dB. What Figs. 1, 2 and 3 show is called the desensitization of the receiving device measured in dB.
What is desensitization? It is the increase in received signal plus echo power required for reception compared to the minimum usable signal power with negligible echo and other forms of interference. In other words, it is the increase in the noise floor in the channel being received.
As the measured desensitization ranges up to 10 or 11 dB for a 1 dB echo, this can be serious loss in coverage. Instead of a minimum field strength of 41 dB µV/m, (at 615 MHz) the minimum usable field strength may be 51 dB µV/m due to a single active echo from another transmitter in a SFN. Would the FCC grant an increase in ERP to offset the desensitization of existing ATSC receiving devices? I doubt it.
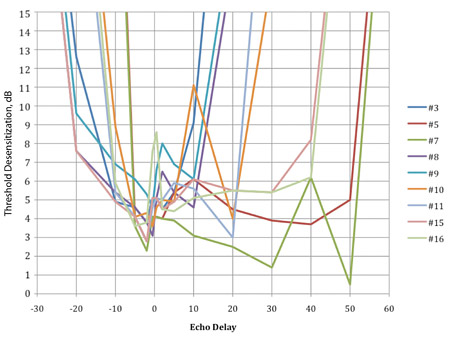
Fig. 2: Desensitization of these “converter boxes” by an echo 3 dB below the signal power D/E = 3 dB.THE PHASE RELATIONSHIP BETWEEN D AND E
In all of these tests, we kept the echo phase fixed. But what if we hadn't? The ATSC signal includes a pilot carrier 0.31 MHz above the lower channel edge. Its purpose is to facilitate synchronization of the receiving device to the desired signal. In a noise-limited environment, (negligible multipath and other kinds of interference) this pilot carrier has proven to be very robust in spite of its low power, roughly 10 dB below the signal power across the channel.
But what if a strong echo such as 1, 3, or 6 dB below the signal plus echo power happens to produce a null at the pilot carrier frequency? We made some measurements of this vulnerability of the pilot carrier. With the strong echoes generated by the other transmitters of a SFN, the pilot can be 'killed."
For this reason, some ATSC chip sets are designed to survive fading of the pilot carrier. This accounts for the variations in robustness whenever one of the minima due to an echo falls near the pilot carrier frequency.
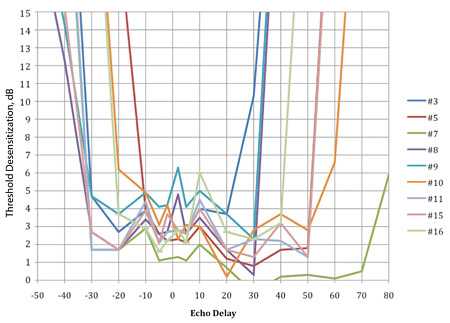
Fig. 3: Desensitization of these “converter boxes” by an echo 6 dB below the power of the signal. There are no minimum performance specs in the FCC rules, and in fact, the FCC does not have authority to set minimum receiver performance specifications. Remember when the Congress gave such authority to the FCC by passing the All-Channel Receiver Act some 40 years ago? That Act authorized setting minimum performance specs for UHF broadcasts relative to VHF receiver performance.
Yes, we've found large variations in what the desensitization is for "converter boxes," and by inference, the desensitization for DTV receivers built with the same IC chip sets, which were used in "converter boxes." That was the bad news.
The good news is that these minima are narrow, but not as narrow as I had once thought. We will need to do more testing. The phase relationship can even change during tower or tree sway, with one of these minima attacking the pilot. I will place spectrum plots of an ATSC signal and a strong echo on the TV Technology website, look for it in this article under "Digital TV."
TWO STATIC ECHOES
We have tried out two close–in echoes, each equal in power to the signal. The Rohde & Schwarz SFE provides what is known as "Brazilian Echo Ensemble E," which was designed to simulate a receiving site approximately equidistant from three DTV transmitters in an SFN.
The signal phase is set to zero degrees, and there's a +1.0 µS echo with a phase difference of 180 degrees, and there's also an additional +2.0 µS echo. A difference in path lengths of 1,000 feet results in a 1.0 µS echo. In the spectrum marked TST 01191 (in the electronic version of this column) echo phase is set to zero degrees for the signal and the 2.0 µS echo with the 1.0 µS echo phase equals 180 degrees. This creates a very beautiful spectrum plot, which you will find on the same online version of this column.
With Brazil E, the pilot carrier power is quite high. In the spectrum plot TST 01192, the phase of the 1.0 µS echo is the same as for both signal and 2.0 µS echo. The phase of the pilot carrier is 16 dB lower than it was in TST 01191 and our tests showed that this is the pathological case.
In conclusion, ATSC receivers are sensitive to a greater or lesser extent to the phase of one or more of the strong echoes, which are generated in a SFN by the emissions of the other transmitters of the SFN in the same community and on the same channel.
Dynamic echoes will be reported on soon. Stay tuned.
Charles Rhodes is a consultant in the field of television broadcast technologies and planning. He can be reached via e-mail atcwr@bootit.com.
The professional video industry's #1 source for news, trends and product and tech information. Sign up below.
