Editor's Note: This article includes references to several PERL scripts/modules that can be downloaded via CPAN.org.
If you have been following the discussions and debates about single-frequency networks—distributed transmission systems or on-channel repeaters using two or more transmitters transmitting at exactly the same data on the same frequency—you've seen them touted as a magical way to free up TV broadcast spectrum for broadband and condemned as a curse that will wipe out TV reception.
This month I'll show you how to determine single-frequency network interference using the digital on-channel repeater network I first described in my November 2009 article "A Digital On-Channel DTV Repeater (DOCR) Service" as a starting point.
I've refined the software I use to analyze interference between multiple on-channel transmitters and added map layers to make it easier to determine if predicted interference is in areas where reception was predicted to be good before the extra transmitters were added, or if, as is often the case, in areas where the signal was predicted to be weak before the repeater was added.
RUNNING THE SCRIPTS
A set of PERL scripts that process the text output available from SPLAT is used to analyze interference. You can find more information on SPLAT at www.xmtr.com/splat. While a version of SPLAT is available for Windows, I strongly recommend running it in Linux. Linux can either be installed on its own partition or on a virtual machine such as Oracle's VirtualBox.
After installing SPLAT, download USGS and SRTM elevation databases for the areas in which you are interested and use the utilities provided with SPLAT to convert them to the format SPLAT uses and to fill in holes in the SRTM elevation data. Here is a command line I used to generate the coverage data:
Splat -t knbc.qth -L 4 -d /home/dl/Topo/srtm/ -R 240 -ano knbc-main_splat_data.txt -metric
Refer to the SPLAT documentation for information on the command line parameters.
I haven't taken the time to add command line arguments to my PERL scripts, so the data files need to be renamed or, preferably, a symbolic link (symlink) created to the name the script is looking for before it is run. Symbolic links are created using the "ln -s" command in Linux.
After generating the splat_data.txt files using the command lines above, the files need to be processed to eliminate duplicate entries and sorted so that they can be combined in the master file that will be used to generate the interference maps.
Link the appropriate data file to splat_data.txt before running the sp3gridproc.pl script using PERL. Many Linux distributions include PERL. For more information on PERL, visit www.perl.org. You will need the Math-Round module, which is available via CPAN.org, to run the sp3gridproc.pl script:
ln -s knbc-main_splat_data.txt splat_data.txt
perl sp3gridproc.pl
This script will produce several files. The only one you need to keep is the splat_xy9.txt file. When the script is finished I recommend renaming it to knbc-main_splat_xy.txt then creating a symlink for use in the next script.
Repeat the process for the next two sites; then create symbolic links to splat_xy1.txt, splat_xy2.txt and splat_xy3.txt. Combine the three files into multi_xy3.txt by running the 3xymulti-3.pl script:
perl 3xymult-3.pl
For the next step, you will need the Geo-distance module for PERL. It is used to calculate the delay in seconds from each of the three transmitters to the point being studied.
This module, available on the CPAN Web site, uses the Haversine Formula to calculate the distance between two coordinates. The multidelay-3tx-KNBC-RF205.pl script reads the multi_xy3.txt file and writes a delay_xy3.txt file.
For each cell where at least one of the transmitters has a signal there is a line with the latitude and longitude (multiply by 1200 to convert to integer), followed by the field strength for transmitters 1, 2 and 3 and the delay to the cell from transmitters 1, 2, and 3. To calculate the delay, the coordinates of each transmitter must be entered into the location variables $tx1lat, $tx1long, $tx2lat, $tx2long, etc. at the top of the script.
DISPLAYING THE RESULTS
The last step is to create the image files and Google Earth kml file showing the maximum signal strength, maximum echo delay, field strength difference, receiver equalizer failure and best transmitter.
The 3xy2png-multi-3tx-20100717-KNBC-RF205.pl script creates these files. It reads the delay_xy3.txt file and uses that data to create the map. There are three variables that have to be modified in this script—$tx1offset, $tx2offset and $tx3offset. These variables are set to the amount of delay to be added to the output of each transmitter.
For this analysis, I used the main transmitter as the reference (offset = zero) and for the repeaters added 7 microseconds to the free space delay from the KNBC Mount Wilson tower to the hypothetical repeater sites at the Arco Tower and Dodger Stadium.
PERL needs another module to generate the PNG files used as overlays on the Google Earth map–GD, available online. See www.cpan.org/modules/INSTALL.html for help installing PERL modules.
If you've made it this far, you are probably wondering if it is worth the effort to analyze DTS and on-channel repeater interference. I've been using and tweaking these scripts for two weeks and after seeing the predicted interference for one design, I've dropped plans for a repeater site that originally looked promising using a simpler interference/delay model.
The 3xy2png-multi-3tx-20100717-KNBC-RF205.pl script plots interference using the median performance of the most popular NTIA-certified DTV converter boxes available in 2009 based on a study conducted for the Metropolitan TV Alliance (MTVA) in New York City by the consulting firm Meintel, Sgrignoli and Wallace. You can modify it to use other equalizer masks.
I recently received an e-mail from Andy Whiteside from Acrodyne Services describing some digital on-channel repeater (DOCR) tests he conducted. His testing found locations where the presence of the repeater signal caused a loss of reception.
He explained, "Analysis of the location of these sites in relation to the main and repeat transmit antennas led us to believe that the problem was caused when the main and repeater signals were of similar amplitude, but with a large time separation, as might be the case for a receive site between the main and repeater antennas.
The main signal will always be seen as a pre-echo, arriving at the receiver before the repeater signal. If the time separation is large and the signals are comparable in strength, even the late generation receivers cannot lock to one of the signals reliably and the presence of the repeater signal will cause loss of reception."
If you look at the maps created by my scripts, you will notice many failure areas are due to pre-echoes—pink or gold in the color code I used. The 3xy2png-multi-3tx-20100717-KNBC-RF205.pl script lists the color codes for all images as remarks in color definitions.

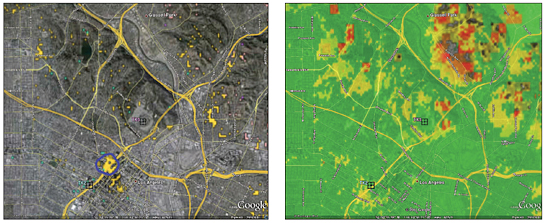
Fig. 1 (left) shows the areas of predicted interference from the repeaters. Fig. 2 shows the maximum signal available from the three transmitters. Notice that the gold area circled in blue in Fig. 1 has a strong signal, but falls outside the receiver equalizer mask by more than 2 dB. The files used to create the maps are available at www.xmtr.com/splat/rf205/. To see the output without running the study simply copy the .kml file and the PNG image files to a directory and open the file in Google Earth. All overlays are opaque when first loaded. Use the transparency fader in Google Earth to view one or a combination of the image overlays.
Fig. 1 shows the areas of predicted interference from the repeaters. Fig. 2 shows the maximum signal available from the three transmitters. Notice that the gold area circled in blue in Fig. 1 has a strong signal, but falls outside the receiver equalizer mask by more than 2 dB. These and additional figures are available at www.xmtr.com/rf205/.
I'm still testing and modifying the scripts. Some of the interference areas are quite far from the low-power repeaters, leading me to question whether the scripts are over-predicting interference. The scripts aren't intentionally "user-hostile" but I haven't spent any time making them "user-friendly." My focus has been on making the scripts work and provide useful output. If you come up with bug fixes or other improvements please let me know and I'll share them.
Comments are welcome! E-mail me atdlung@transmitter.com.
The professional video industry's #1 source for news, trends and product and tech information. Sign up below.

Doug Lung is one of America's foremost authorities on broadcast RF technology. As vice president of Broadcast Technology for NBCUniversal Local, H. Douglas Lung leads NBC and Telemundo-owned stations’ RF and transmission affairs, including microwave, radars, satellite uplinks, and FCC technical filings. Beginning his career in 1976 at KSCI in Los Angeles, Lung has nearly 50 years of experience in broadcast television engineering. Beginning in 1985, he led the engineering department for what was to become the Telemundo network and station group, assisting in the design, construction and installation of the company’s broadcast and cable facilities. Other projects include work on the launch of Hawaii’s first UHF TV station, the rollout and testing of the ATSC mobile-handheld standard, and software development related to the incentive auction TV spectrum repack. A longtime columnist for TV Technology, Doug is also a regular contributor to IEEE Broadcast Technology. He is the recipient of the 2023 NAB Television Engineering Award. He also received a Tech Leadership Award from TV Tech publisher Future plc in 2021 and is a member of the IEEE Broadcast Technology Society and the Society of Broadcast Engineers.
