TNS Issues Ad Spending Figures for First Six Months of ’09
NEW YORK: Total measured advertising expenditures in the first six months of 2009 fell 14.3 percent versus a year ago, to $60.87 billion, according to TNS Media Intelligence. The results are in line with similar measurements from Nielsen, which estimated that ad spending fell 15.4 percent for the first half of the year. Both TNS and Nielsen combine ad spending across a variety of TV, radio, print and online categories, but their calculations yield slightly different results.
E.g., TNS estimated that ad spending on network TV for the six-month period was down 5.5 percent; Nielsen had it down by 7 percent; the Television Bureau of Advertising, by 5.8 percent, from $13.1 billion last year to $12.4 billion this year.
Whatever the source and methodology, it’s clear that ad spending is down this year. TNS found ad spending during second quarter of 2009 dropped nearly 14 percent, the fifth consecutive quarter of year-over-year declines.
“The rate of decline in ad spending was level throughout the second quarter,” said Jon Swallen, of TNS Media Intelligence. “While it’s tempting to interpret this as a positive indicator that things aren’t getting worse, the fact remains that the market has been steadily tracking at around 14 percent declines for several consecutive months and this represents billions of lost revenue. Early data from third quarter hint at possible improvements for some media due to easy comparisons against distressed levels of year ago expenditures.”
Ad Spending by Media
Internet display, up 6.5 percent, and free-standing inserts, up 4.6 percent, were the only media platforms to post growth during 1H09. Print, TV, radio and outdoor were all down. Cable was off 3.6 percent; spot was down 27.1 percent and Spanish-language TV dropped 12.7 percent.
Ad Spending by Category
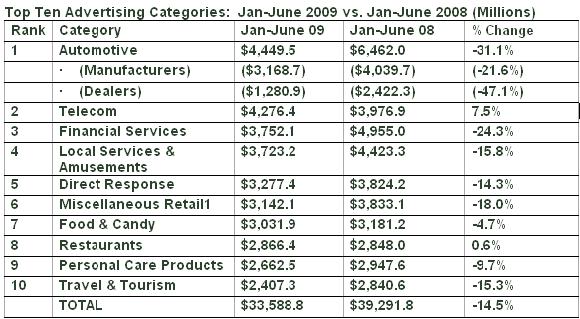
Automotive remained the largest category, though it was down by nearly one-third. Auto advertisers spent $4.4 billion during 1H09 compared to $6.5 billion last year. Dealer spending was off more sharply than manufacturers. Through June, auto advertising is pacing at a level one-half its 2005 peak.
The ten largest advertising categories spent a total of $33.6 billion, down 14.5 percent from a year ago. Heightened competition among wireless phone companies and TV service providers boosted telecommunications category spending to $4.3 billion, an increase of 7.5 percent. Restaurants represented the only other gain among the top 10, up 0.6 percent to $2.9 billion.
Ad Spending by Advertiser
The top 10 advertisers in 1H09 spent nearly $7.9 billion, down 3.5 percent from last year. Verizon Communications was No. 1 with a spend of nearly $1.2 billion, up more than 3 percent from last year. P&G was next, with just under $1.2 billion, down 20 percent. The company pared its TV budgets by 30 percent while leaving magazine spending untouched.
AT&T was the third largest advertiser with total ad expenditures of $977 million, up 6.3 percent versus a year ago. Sprint Nextel, after slashing its ad budgets in 2008, reversed course and spent $631.1 million, a gain of 55.3 percent.
The only other packaged goods marketer in the top 10 was Johnson & Johnson which spent $806 million, up 18 percent.
General Motors had the largest budget reduction among the top 10 with spending down 25.9 percent to $773.1 million and was the only auto maker to make the list.
Media companies rounded out the top 10 with General Electric posting a spending increase of 5.1 percent while News Corp., Time Warner and Walt Disney each finished the period with decreases. At each of these advertisers, results were primarily shaped by their movie studio divisions.
Product Placement and Brand Appearances
TNS Media Intelligence said it monitors branded entertainment within network prime-time and late-night programming, identifying brand appearances and duration.
During 2Q09, the average hour of monitor prime-time network programming contained 9 minutes, 51 seconds, of in-show brand appearances, up 19 percent from a year ago. In addition, there was 14:05 per hour of network commercial messages. The combined total of 23:56 of marketing clutter represented 40 percent of a prime-time hour.
Unscripted reality programming had an average of 16:42 per hour of brand appearances as compared to just 5:52 per hour for scripted programs such as sitcoms and dramas.
Late night network talk shows averaged 11:31 per hour of brand appearances. The combined clutter level of brand appearances and network ad messages in these shows reached 26:48 per hour, or 45 percent of total programming time.
Among all monitored network programming during the period, “Hell’s Kitchen” had the highest average volume of brand appearance time at 58 minutes, 14 seconds (58:14) per hour. Rounding out the top five were “Celebrity Apprentice” (49:58); “Biggest Loser: Couples” (45:02); “American Idol” (42:44); and “Chopping Block” (33:13).
More on ad spending:
September 11, 2009: “TV Ad Bureau Predicts Spot Revenue Rise in 2010”
It’s not a lot, but it’s something. The Television Bureau of Advertising predicted spot revenues for local TV stations would rise next year by 1 to 3 percent.
September 1, 2009: “U.S. Ad Spending Drops 15 Percent During First Half of ’09”
U.S. advertising across TV, radio, print and billboards fell 15.4 percent during the first half of 2009 compared to the same period a year ago, Nielsen said today. Preliminary figures show that U.S. ad expenditures declined by more than $10.3 billion to a total spend of $56.9 billion in the first two quarters.
August 31, 2009: “Local Broadcast Revenues Dive 26 Percent in 2Q”
Total broadcast television ad revenues were down 12.8 percent in the second quarter of 2009 versus the same period last year, according the Television Bureau of Advertising’s analysis of numbers provided by TNS Media Intelligence.


The professional video industry's #1 source for news, trends and product and tech information. Sign up below.
