The unbridled development of radio broadcasting in the 1920s and 1930s demonstrated the need to standardize audio equipment, studio-to-transmitter links, and methods for measuring static and dynamic audio signal levels. Unrelated concepts and solutions developed on both sides of the Atlantic during that time, and today we still bear the consequences of these developments.
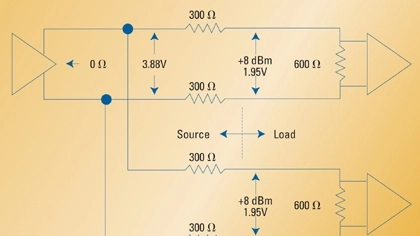
Figure 1. Typical block diagram of power matching circuit
Typical signal levels and impedances
A wide variety of studio-quality audio equipment is available. In terms of signal level, there are two main categories: low-level devices (typically microphones) and high-level devices (everything else).
Microphone sensitivity ratings, measured at 74dB sound pressure level (SPL), are commonly expressed in open-load microvolts or dBV (decibels with respect to 1V). Impedances of professional-quality microphones are standardized at 150Ω, but other values are also encountered in practice. A typical moving-coil microphone, with a source impedance of 150Ω, generates an open-load voltage of 100µV (80dBV at 74 SPL). The input impedance of the microphone preamplifier bridges the microphone output, that is, it has a value of 1.5kΩ or higher, to avoid microphone damping and input signal-to-noise degradation due to excessive signal loss.
Audio signals generated by microphones are suitably pre-amplified to line levels and distributed inside broadcast plants or to common carriers for land or satellite transmission. There are two conflicting sets of concepts for line level, interface impedance and signal level monitoring.
Power matching, dBm and the VU meter
Power matching: This concept was developed by Bell Telephone and first standardized in 1939. The main concern was to develop reliable, high-performance, studio-to-transmitter links. It seemed reasonable to have a system consisting of an impedance-matched source (studio output), a distribution link (cable) and a destination (radio transmitter input). The impedances had to be matched to tight tolerances to avoid echoes on long cable lengths. So Bell specified the impedance as 600Ω, the reference signal power as 1mW, and the signal-level measurement instrument as the volume-unit meter — better known as the VU meter.
Given the tube amplifier technology of the 1930s, it may have been necessary to use the power-matching concept inside a studio at that time. But contemporary audio-amplifier output impedances are typically a fraction of 1Ω (for all intents and purposes, 0Ω), so raising the impedance to 600Ω represents a power loss. Figure 1 shows the distribution of a typical power-matched, 600Ω impedance audio signal. The 600Ω build-up impedance causes a 6dB voltage loss between the signal source (the pre-amp output at 0Ω) and the load (the line-level amplifier input at 600Ω).
Figure 2. Typical block diagram of voltage matching concept
The dBm: One milliwatt dissipated into a 600Ω impedance generates a 0.77459V RMS voltage (rounded up to 0.775V RMS). So this signal level was designated as 0dBm. When dissipated into other load values, different voltages result. Power levels other than 1mW are expressed in dB with respect to the reference 0dBm power level according the formula:
N(dB) = 10 log10 (P/Pref)
where N(dB) = The number of decibels
P = The measured power level
Pref = The reference power level of 1mW
The formula can be extended to the measurement of voltages as follows:
N(dB) = 20 log10 (V/Vref)
where N(dB) = The number of decibels
V = The measured voltage
Vref = The reference voltage of 0.775V RMS
The assumption here is that the voltage is measured across identical impedances (e.g., 600Ω)
A standard operating level (SOL), also called alignment level, of +8dBm into 600Ω was originally chosen in North America. Some authorities, including sound-recording studios, opted for a +4dBm SOL inside the plant. The SOL represents the steady-state maximum level or peak program level as measured with a standardized audio-signal-level meter (VU meter).
The VU meter: The VU meter was developed primarily to control and monitor audio programs. The specifications of the VU meter reflect the philosophy of the 1930s. Essentially, the VU meter is a moving-coil, RMS-type audio-signal-level measuring instrument. It is fitted with two scales:
- A VU scale, extending from –20 to +3, with 0 (the reference deflection) marked at about 71 percent maximum scale reading
- A percentage scale, with 100 percent corresponding to 0 VU The VU meter has an input impedance of 7.5kΩ and, as such, has a minimal loading effect on the 600Ω source impedance. Its sensitivity is adjustable such that the VU reference level (0 VU) can be made to correspond to the SOL (+4 or +8dBm) under steady-state sinusoidal voltage conditions. Its dynamic characteristics are such that if a sinusoidal signal with certain characteristics is suddenly applied, the pointer will take 0.3s to reach reference deflection. The signal that will produce this effect is one that has a frequency between 35Hz and 10kHz and an amplitude that produces a reference pointer deflection (0 VU) under steady-state conditions. This characteristic of the VU meter was chosen to approximate the assumed response of the human ear. But the 0.3s risetime characteristic of the VU meter introduces a masking effect. Essentially, the instrument is unable to give accurate audio-signal-level indications when fed complex-wave, fast-risetime input signals. An instantaneous speech or music signal level may in reality be 10 VU or more above the readings of the VU meter. As a result, the recording and distribution elements in the system need quite a bit of headroom to avoid clipping the sudden bursts that often occur in audio signal levels. Typically, audio equipment designed to handle an SOL of +8dBm is capable of handling output signal levels in excess of +18dBm at a total harmonic distortion (THD) not exceeding 1 percent. Such undistorted audio peaks, unnoticed by the operator watching the VU meter, are likely to reach the audiotape recorder or transmitter and overload it. The situation is further complicated by FM audio transmitters that use high-frequency pre-emphasis with a time constant of 75µsec, resulting in a 14dB boost at 10kHz. To avoid overmodulation and achieve an acceptable SNR, transmitters use various types of limiter/compressor combinations.
Figure 3. Masking effect of typical VU meter and PPM for a given tone duration
Voltage matching, dBu and the peak-program meter
Voltage matching: This concept is typical of modern studio installations. Figure 2 shows a typical voltage-matching, audio-signal distribution. The signal source has an output impedance of approximately 50Ω and the load is approximately 20kΩ. The signal level is expressed in dBu and the SOL in North America is +4dBu or +8dBu. This considerably reduces the power requirements of the signal source, since it is required to dissipate only a minute amount of power across the load. An added advantage is the improved frequency and transient response of the system, resulting from the fact that the capacitive loading of the shielded-balanced audio cable has a lesser effect across a source impedance of 50Ω than it has across a source of 600Ω. The interface with common carriers retains the power-matching philosophy to avoid return-loss problems with long cables, which could result in echoes.
The dBu: The dBu assumes a near-zero signal source impedance and a near-infinite load impedance. Under these idealized open-load conditions, the source does not dissipate any measurable power into the load and the signal source voltage is unaffected by the load. The reference signal is 0.775V RMS. For practical purposes, the dBu concept requires signal source impedances of approximately 50Ω and load impedances equal to or greater than 20kΩ.
The audio signal levels are expressed according to the formula: N(dB) = 20 log10 (V/Vref)
where N(dB) = The number of decibels
V = The measured voltage level
Vref = The reference voltage of 0.775V
The peak-program meter (PPM): The PPM is a peak-reading instrument capable of accurately displaying audio-signal transients. The meter’s input impedance is bridging, that is, it is greater than 6kΩ. Some current designs feature a 10ms attack time (risetime) and a 2.65s fallback time. This characteristic amounts to a “sample-and-hold” approach to audio signal-level monitoring. It allows the user to accurately monitor audio signal levels under steady-state as well as program conditions and reduces the need for large amounts of headroom in amplifiers. Neither the scale nor the display is universally standardized. Some type of compression is required to reduce the dynamic range of the audio signal, which otherwise would exceed the transmitter and receiver capabilities.
Figure 4. Upper-scale details of some audio level meters used throughout the world and the corresponding steady-state signal level in dBu
Living with the two types of meters
Unfortunately, there are two entrenched camps: one steadfastly preferring the PPM and the other preferring the VU meter. Figure 3 shows that the PPM is capable of more accurately displaying audio signal peaks than the VU meter. In an effort to satisfy all users, some contemporary equipment manufacturers offer equipment with selectable VU or PPM rise/fall times.
Figure 4 shows details of the upper part of the display scale of some audio-level meters used in various countries. This drawing clearly shows that, in addition to transit-response differences, various organizations have different reference levels (SOL) and meter display scales. This situation creates problems in international television program exchanges, and is not likely to change in the near future. The problem is complicated by digital equipment that normally references all audio levels to the maximum signal level before clipping, which is identified as 0dBFS (zero dB full-scale).
Therefore, all audio levels have a negative-dBFS value, with the SOL set normally to -20dBFS indicating that the equipment has a 20dB headroom. This new approach creates confusion with audio operators who have an analog background and a strong attachment to the VU meter.
